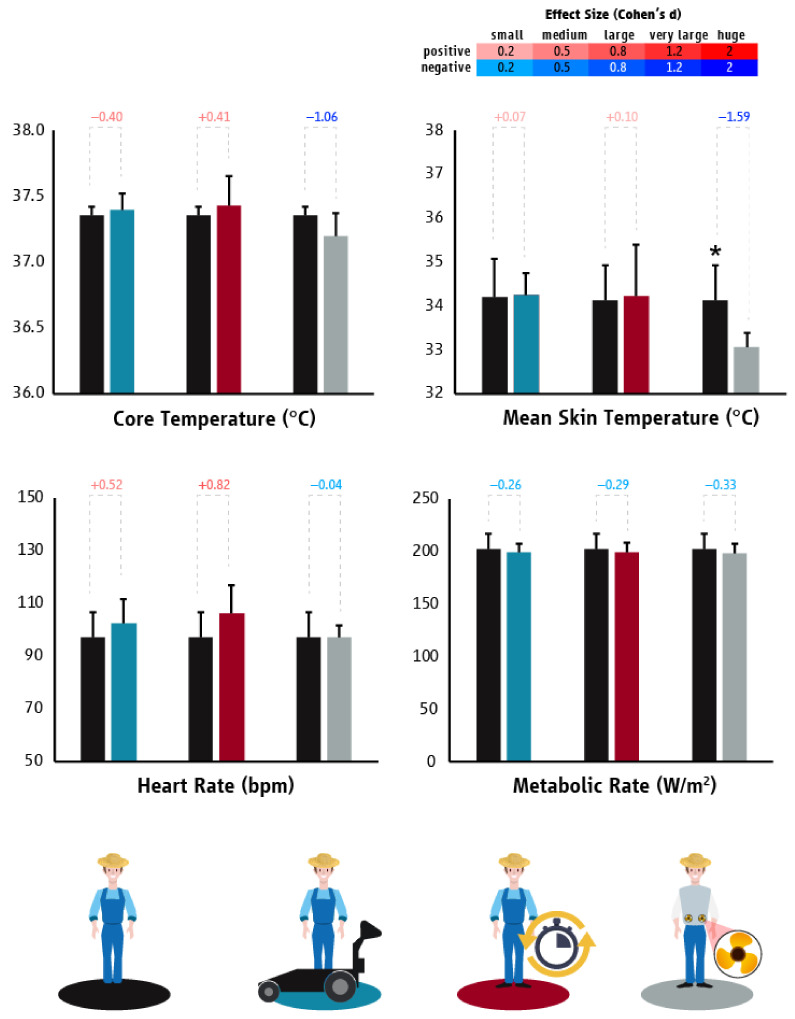
Figure 5.
Differences (mean ± SD) in core temperature, mean skin temperature, heart rate, and metabolic rate/work intensity between “business as usual” and the tested heat mitigation strategies in the agriculture sector of Cyprus. Black, light blue, red, and grey colors represent “business as usual”, mechanical fruit cart, planned breaks, and ventilated garments scenarios, respectively. Asterisk indicates statistically significant difference between “business as usual” and the tested heat mitigation strategy. Cohen’s d effect sizes show the magnitude (small: 0.2; medium: 0.5; large: 0.8; very large: 1.2; huge: 2.0) and direction (positive: shades of red; negative: shades of blue) of the differences between “business as usual” and the tested heat mitigation strategies.

