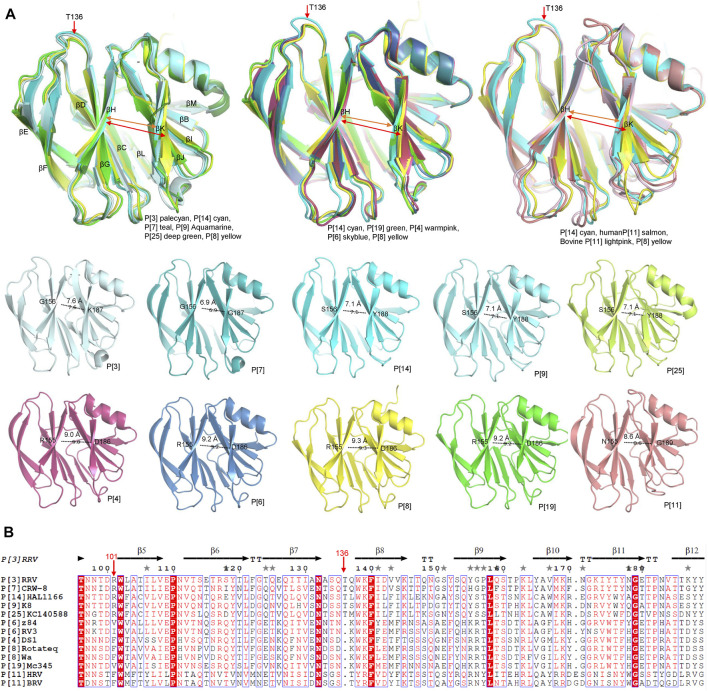
FIGURE 3.
(A) Structural analysis of the VP8* structures. Superimposition of the VP8* structures to compare the width of the cleft between two β-sheets (βH and βK). The width of the cleft in VP8*s of different P genotype are measured. P[3], P[7], P[9], P[14], P[11], P[19], P[4], P[6], P[8] VP8*s are colored as described in Figure.2A and P[25] is colored deep green (PDB ID: 7C8P). (B) The structural based sequence alignment was constructed using Clustal Omega and displayed with the ESPript 3.0 (https://espript.ibcp.fr/ESPript/cgi-bin/ESPript.cgi). Residue 101 and 136 were pointed with red arrows.

