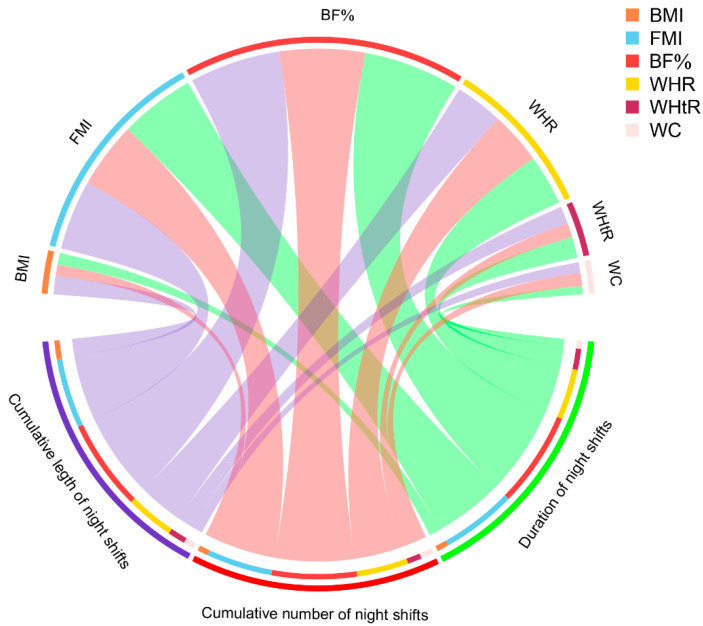
Figure 1.
Chord diagram for partial correlations of different exposure metrics of night shift work with FMI and BF%. The width of the arcs in different colors represents the magnitude of the partial Spearman correlation coefficient. BMI, body mass index; BF%, body fat percentage; FMI, fat mass index; WC, waist circumference; HC, hip circumference; WHtR, waist-to-height ratio; WHR, waist-to-height ratio.

