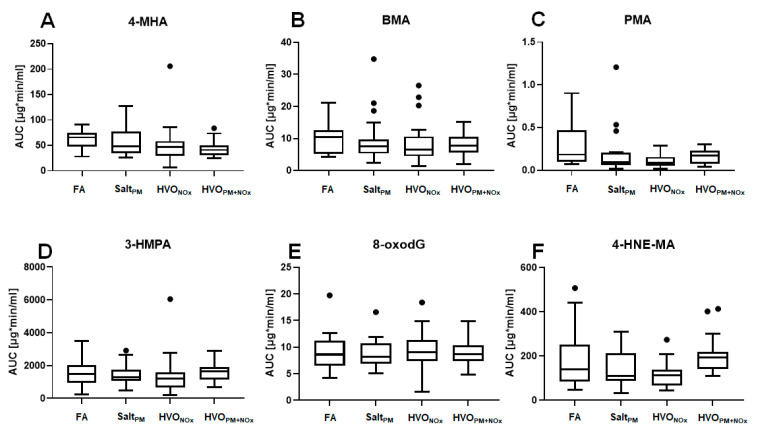
Figure 3.
Total excretion of biomarkers, calculated as the area under the excretion curves (AUCs). Box-and-whisker plots display the medians and upper and lower quartiles. Outliers are plotted as individual points. AUCs were calculated for 4-MHA (A), BMA (B), PMA (C), 3-HPMA (D), 8-oxodG (E), and 4-HNE-MA (F), after the following exposure scenarios: filtered air (FA), particle control (SaltPM), HVO exhaust from a modern non-road vehicle with aftertreatment system (HVONOx) and without exhaust aftertreatment (HVOPM+NOx). Statistical analyses of spot urine samples were performed using Mann–Whitney U test (no significant difference from FA was observed, p < 0.05). All data are presented in Table S5.

