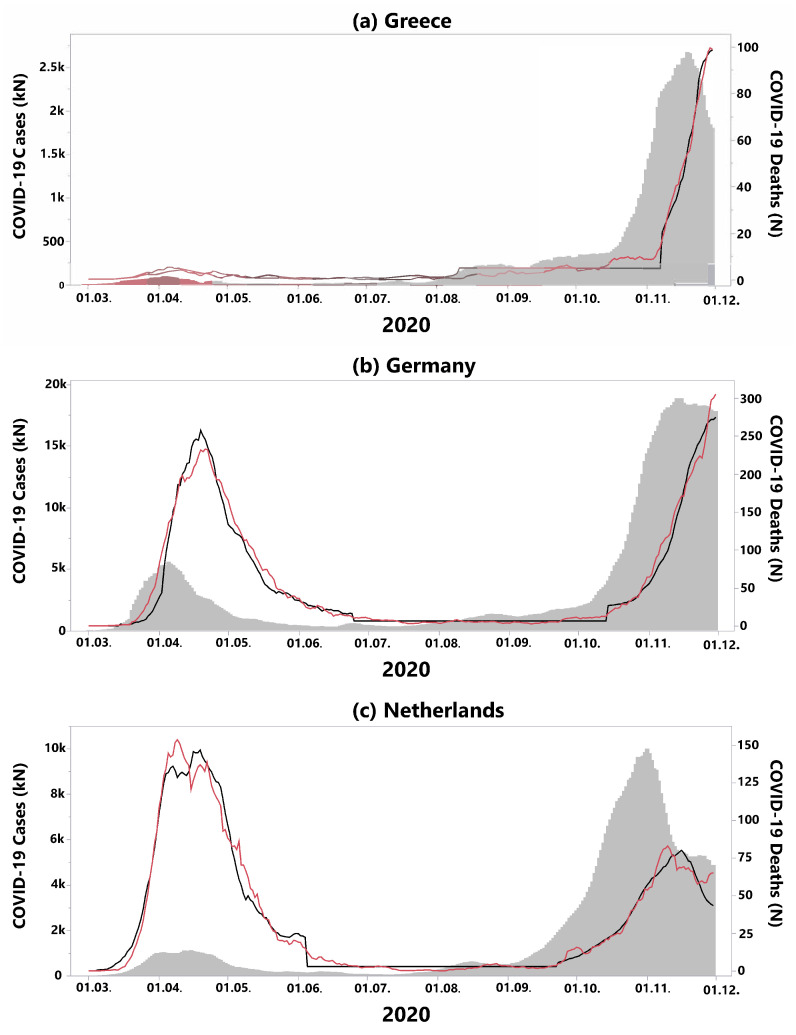
Figure 1.
Examples of time series analyses performed on the temporal incidence of SARS-CoV-2 infections (grey area, left scale) and the incidence of COVID-19 associated deaths (red line, right scale). The three-phase-prediction model (black line, right scale) for COVID-19 associated deaths based on actual incidences has been estimated for each country. The second phase of the model with a constant number of deaths is identifiable by the horizontal black line. (a) Greece (cluster 1), exhibits a constant increase of incidences over time ( and ). (b) For Germany ( and —cluster 2), and (c) the Netherlands ( and —cluster 3), the threshold effect is particularly visible: the case fatality rates did not increase during the summer months, despite a relevant increase of COVID-19 incidences.

