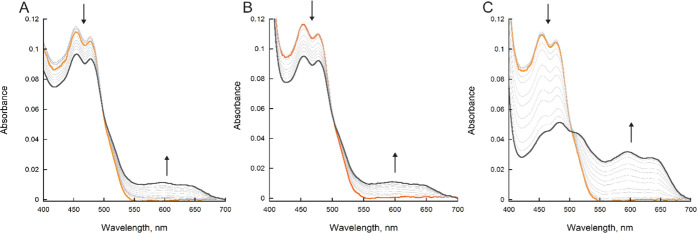
Figure 2.
BauF reduction. (A) Spectral changes of BauF over 900 s, showing photoreduction. (B) Spectral changes of BauF reduction with 1 mM NADH over 900 s. (C) Spectral changes of BauF reduction with 1 mM DT over 900 s. Oxidized BauF is represented as orange and semiquinone as gray. Spectral changes of BauF reduction with 1 mM NADPH were similar to NADH (not shown).

