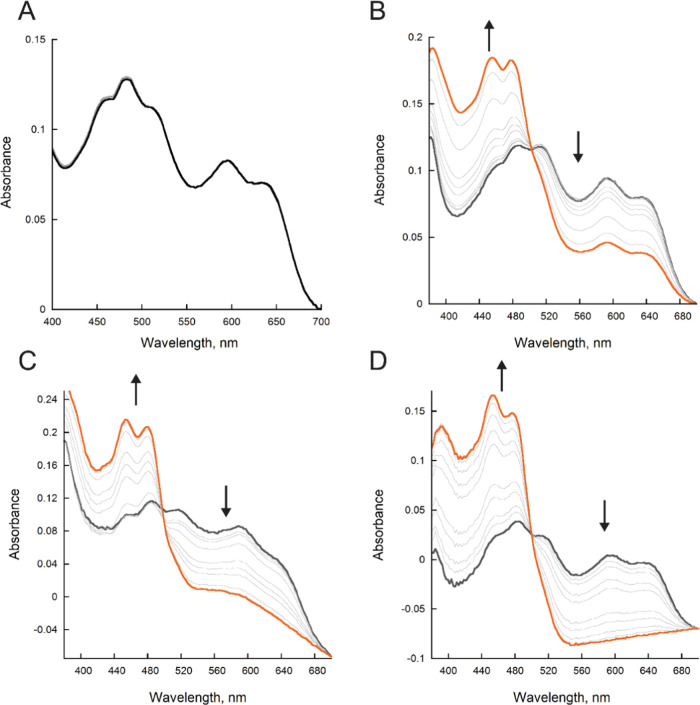
Figure 4.
BauF oxidation. (A) Spectral changes of BauF under anaerobic conditions. (B) Spectral changes of BauF in the presence of 600 μM oxygen. (C) Spectral changes of BauF in the presence of 100 μM Acb-Fe. (D) Spectral changes of BauF in the presence of 100 μM ox-pre-Acb-Fe. The reduced enzyme is represented as gray and the final oxidize spectra are orange. All assays were recorded for 450 s.

