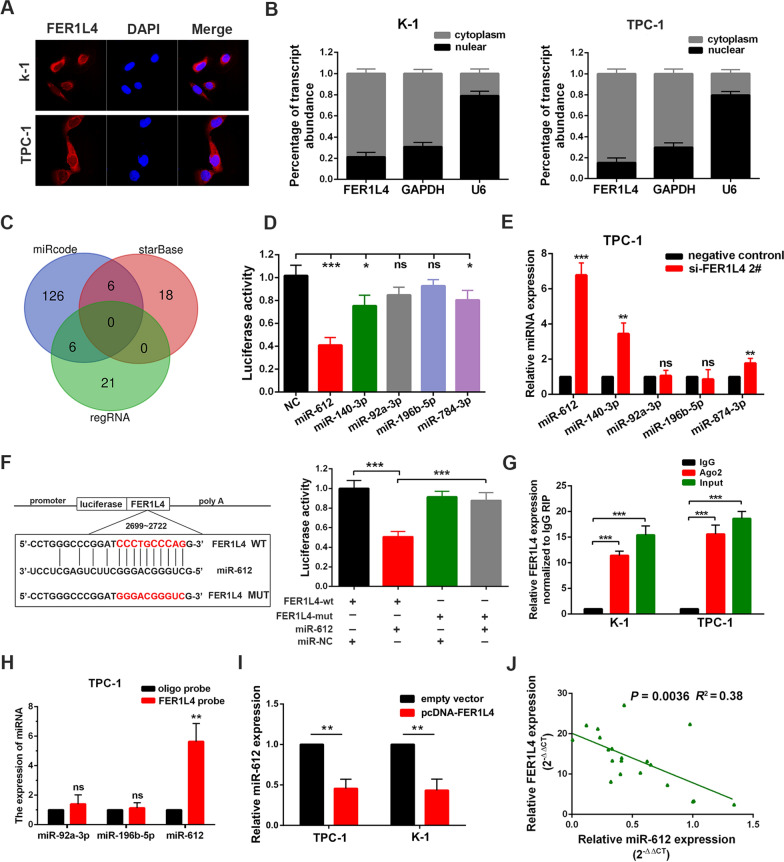
Fig. 4.
FER1L4 functioned by binding with miR-612 in PTC. A Cellular localization of FER1L4 in PTC cells as suggested by FISH assay. Nuclei were stained as blue, and FER1L4 was labeled by Cy3 as red. Scale bars represent 50 μm. B Subcellular fractions assays for FER1L4 in K-1 and TPC-1 cells. U6 and GAPDH were used as nuclear and cytoplasmic markers, respectively. C MiRNAs with Potential binding sites to FER1L4 were predicted by online tools. D Luciferase activity was detected in PTC cells co-transfected with miRNA mimics and luciferase reporter plasmids. E The expression level of miRNAs after knockdown of FER1L4 in TPC-1 cells. F The binding sequences of miR-612 to FER1L4 were mutated (left panel). And luciferase activity was detected as indicated (right panel). G RIP assays were performed in PTC cells using an anti-Ago2 antibody, followed by qRT-PCR analysis for FER1L4. H qRT-PCR analysis of miRNAs expression in the RNA complex pulled by FER1L4 probe or oligo probe. I Expression of miR-612 in PTC cells transfected with FER1L4 vectors of control. J Pearson correlation analysis between miR-612 and FER1L4 in 20 paired PTC tissue samples. Error bars, mean ± SD. * P < 0.05; ** P < 0.01; *** P < 0.001

