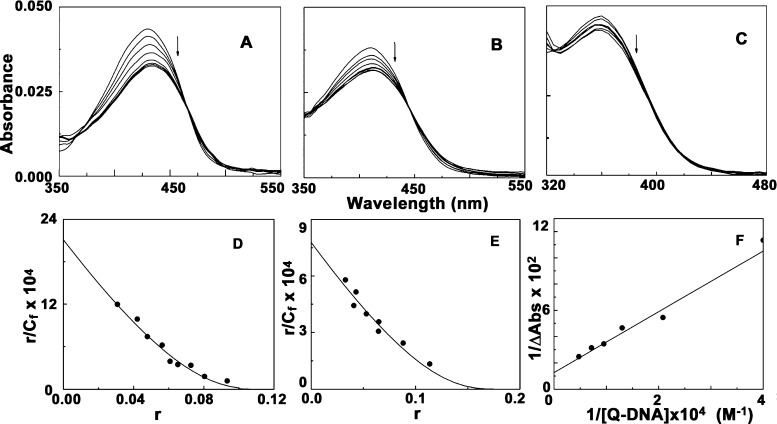
Figure 2.
Representative absorption spectral titration of [A] ALM (5 μM) treated with c-KIT (0–135 μM), [B] ALMG (5 μM) treated with c-MYC (0–180 μM), and [C] ALN (5 μM) treated with BCL-2 (0–250 μM). Scatchard plots of [D] ALM-c-KIT complexation and [E] ALMG-c-MYC complexation. The solid lines represent the non-linear least square best fit of the experimental points to the neighbor exclusion model. [F] Benesi–Hildebrand plot for ALN- BCL-2 complexation.

