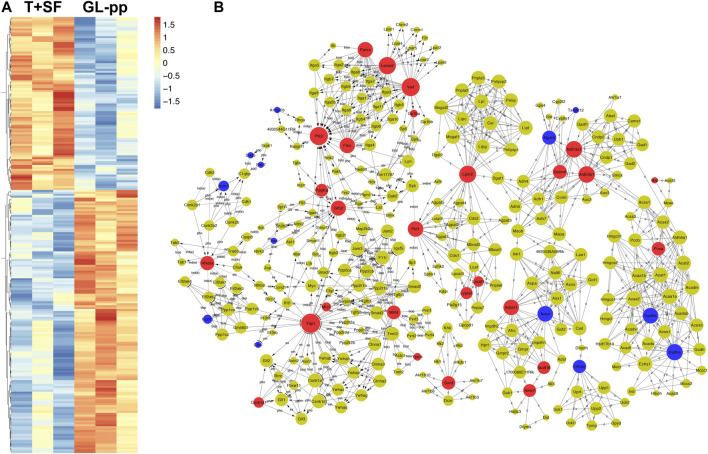
FIGURE 4.
Quantitative protein expression profiling and the global signal transduction network of the significantly altered genes between the T + SF group and the GL-pp group. (A) Heat map of 227 significantly differentially expressed proteins between the T + SF group and the GL-pp group with the gene names listed on the right (orange indicates a higher expression level, and blue indicates a lower expression level, p < 0.05). (B) The global signal transduction network, the nodes in which were connected when their corresponding encoded gene products were connected directly or indirectly by a linker gene in the interaction network, and the size of each node indicates the degree of the gene. Red indicates upregulated and blue means downregulated key regulatory genes.

