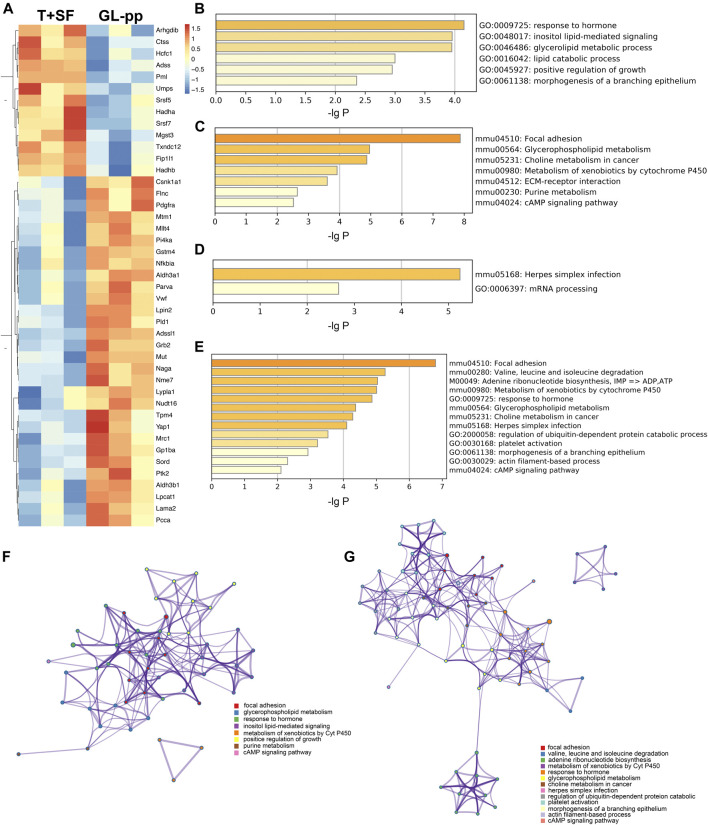
FIGURE 5.
The key regulatory genes between the T + SF group and the GL-pp group and the function enrichment analysis. (A) Heat map of 43 key regulatory genes between the T + SF group and the GL-pp group with the gene names listed on the right (orange indicates a higher expression level, and blue indicates a lower expression level). (B) The significantly upregulated GO biological process clusters with upregulated different genes. (C) The significantly upregulated KEGG pathway clusters with upregulated different genes. (D) Significantly downregulated GO biological process and KEGG pathway clusters with downregulated difference genes. (E) Significantly altered GO biological process and KEGG pathway clusters among all 43 key regulatory genes. (F) The network plot of significantly upregulated pathways was visualized with Cytoscape software. (G) The combination of significantly altered pathways was visualized with Cytoscape software. Each node represented an enriched term, and nodes were colored by clusters, that is, the same color in the network means the same; for example, red represents focal adhesion.

