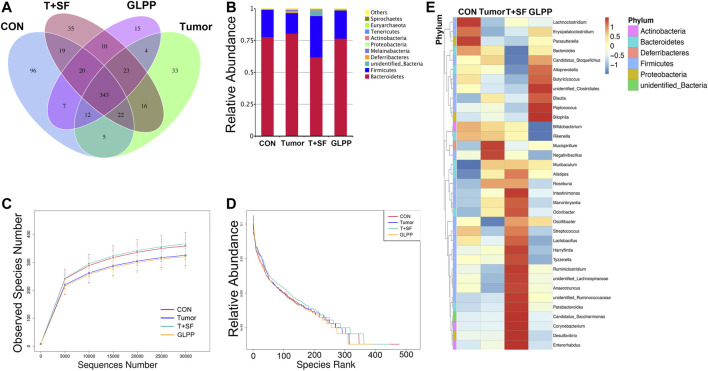
FIGURE 6.
Effect of GL-pp on species number and relative abundance of the gut microbiota in mice with B16-F10-luc-G5 and SF. (A) The Venn diagram of OTUs in CON, Tumor, T + SF, and GL-pp groups. (B) Relative abundance of the gut microbiota in the four groups at the phylum level. (C) The rarefaction curves. (D) The relative abundance curves. (E) The heat map of top 35 genera of gut microbiota in the four groups with the phylum on the left side (different phyla are shown in different colors).

