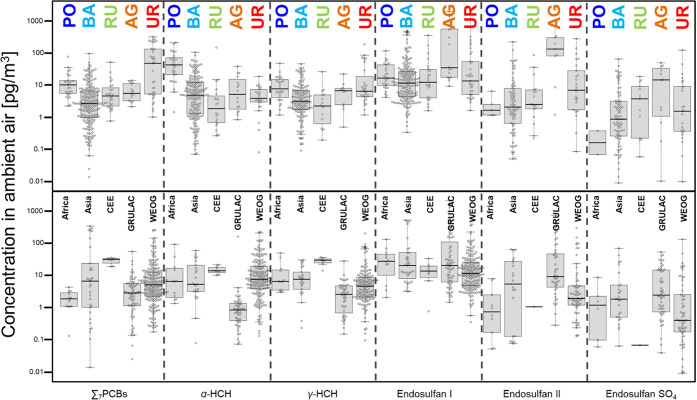
Figure 2.
Global concentrations of ∑7PCB, α-HCH, γ-HCH, endosulfan I, endosulfan II, and endosulfan SO4 for GAPS 2011/2014. The plot depicts the single data points using bee-swarm boxplots to illustrate the median, 25th and 75th percentile (whiskers marking the 10th and 90th percentile). The concentrations are resolved by sampling site type and UNEP regional group. (Site types: PO= polar, BA = background, RU = rural, AG = agricultural, UR = urban; UNEP regional groups: Africa = African Group, Asia = Asia and Pacific Group, CEE = Central and Eastern European Group, GRULAC = Group of Latin America and Caribbean countries, WEOG = Western European and Others Group).

