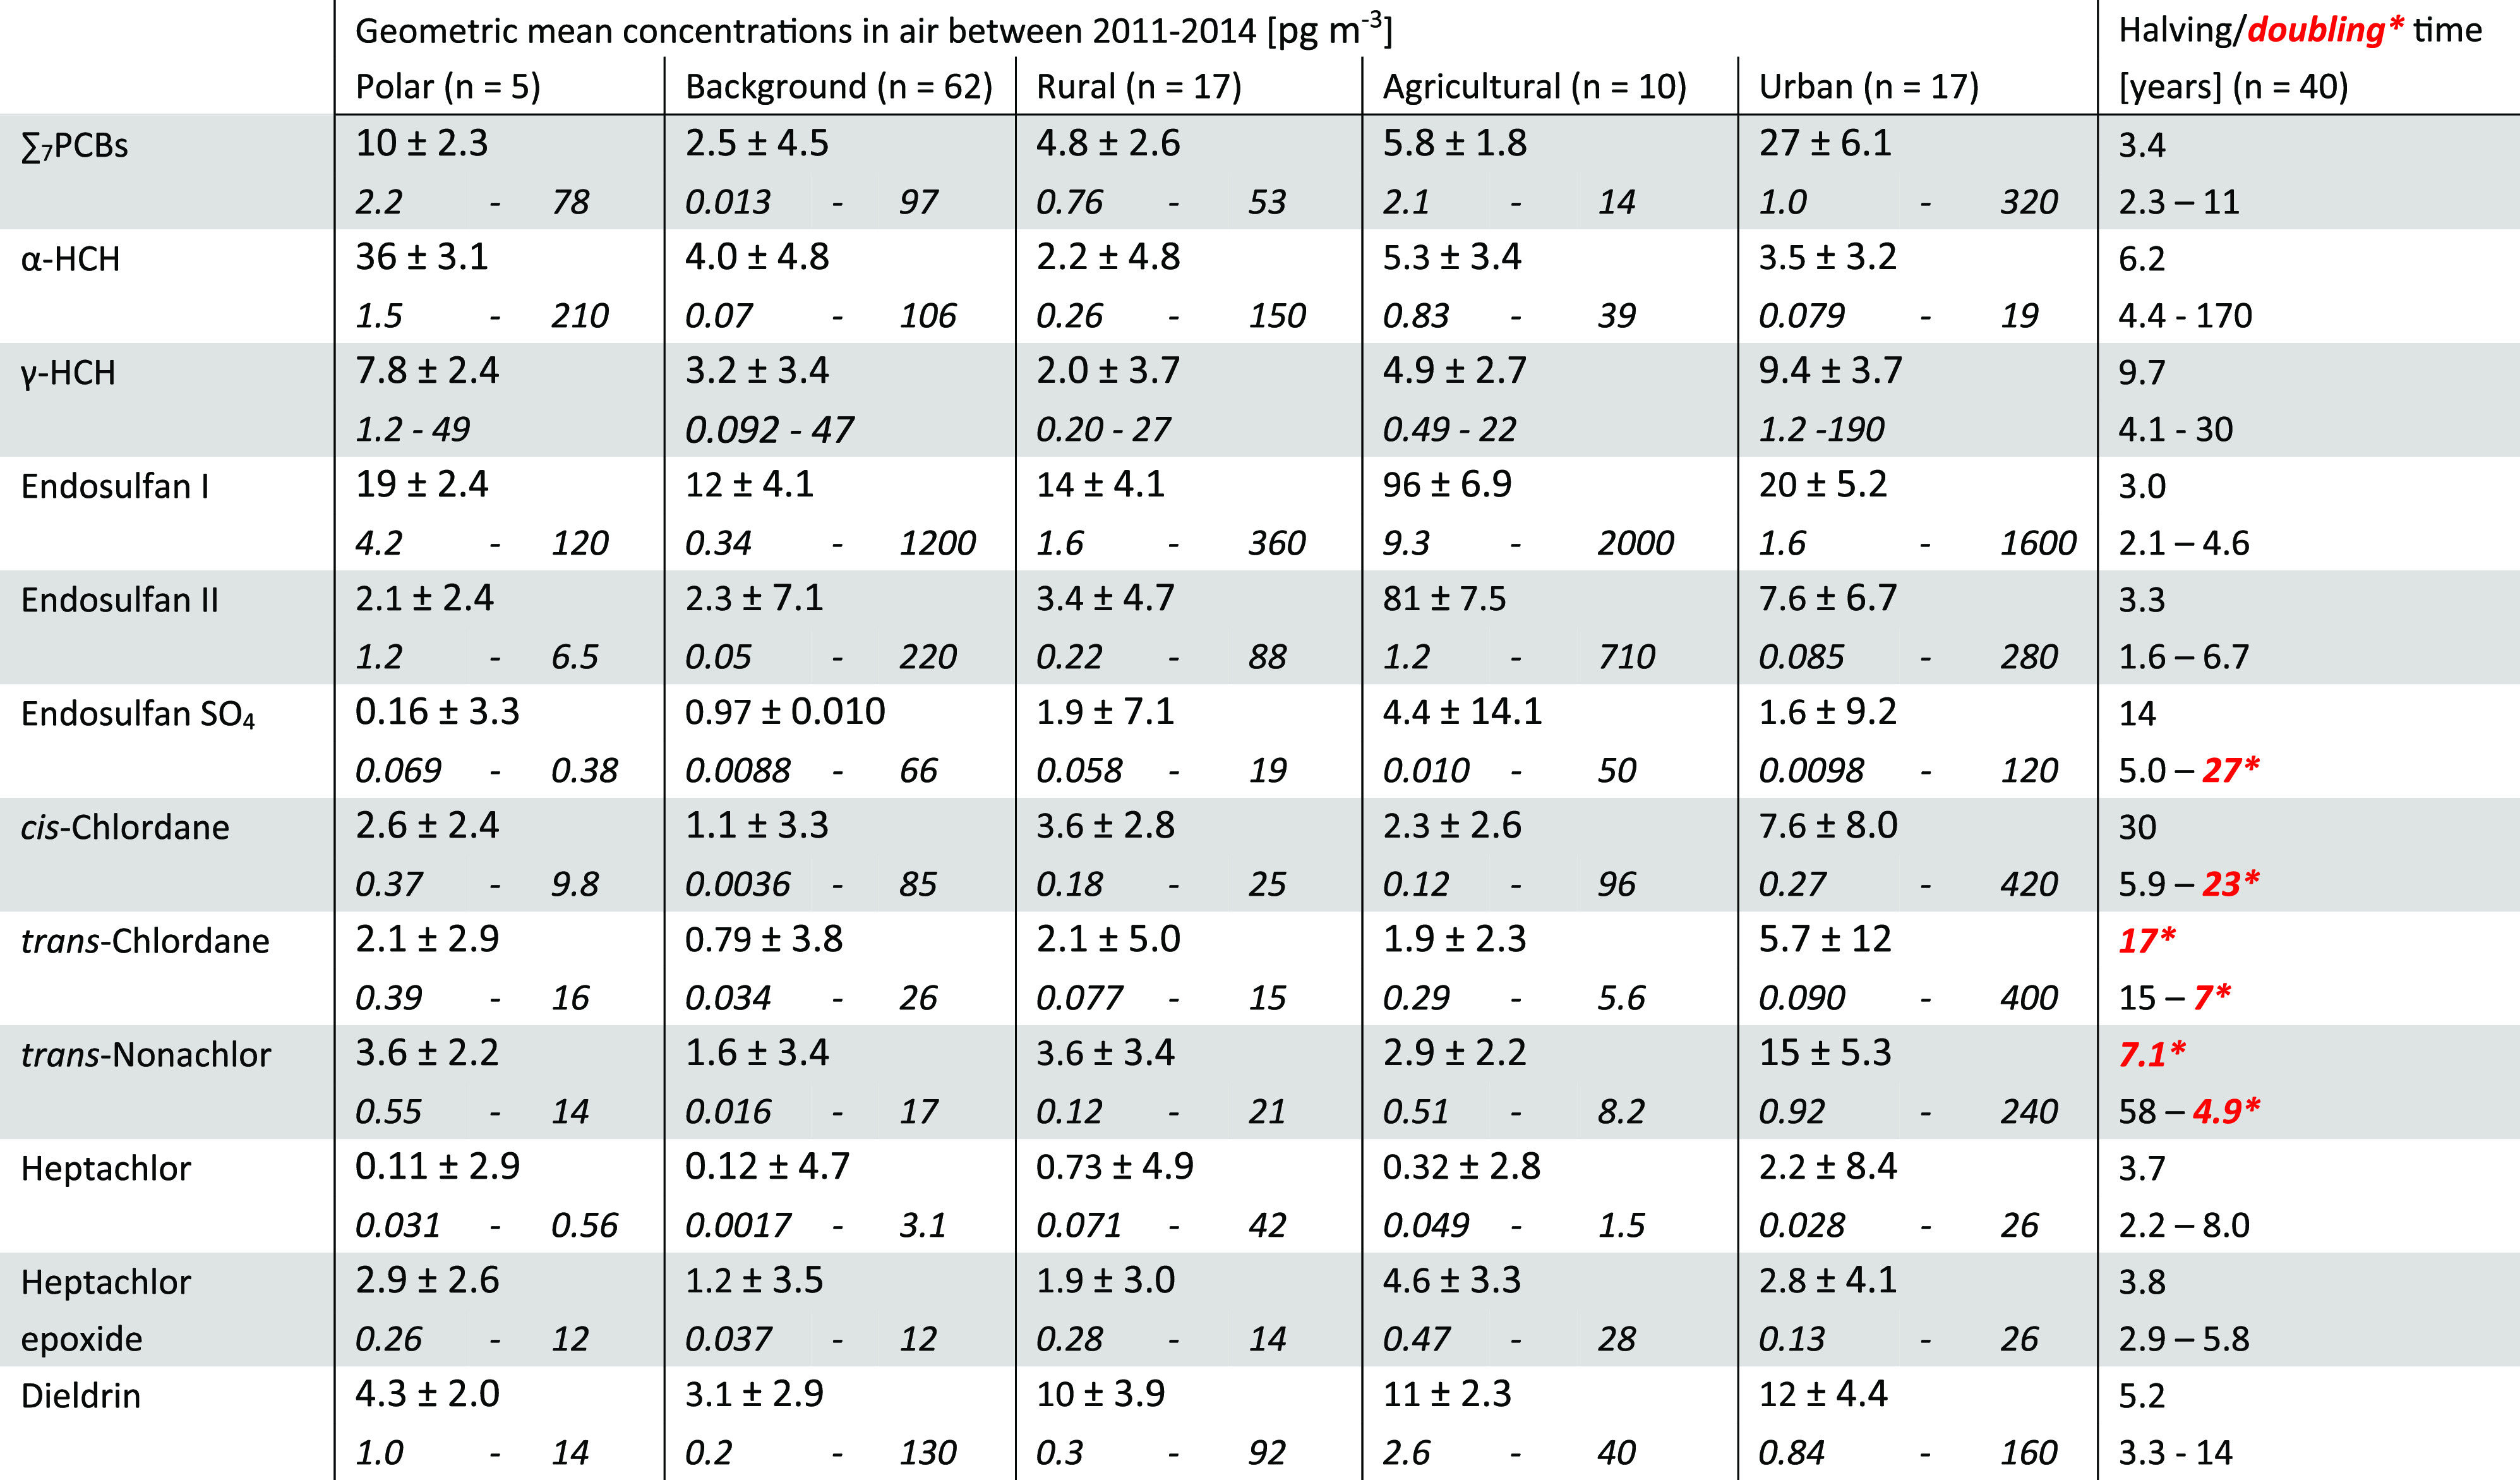
Table 1. Geometric Mean Concentration of Legacy POPs at Different Site Types for GAPS 2011/2014a.

(Including geometric standard deviation, minimum and maximum) and the median halving/doubling times (including the range based on the 25th -75th percentile of temporal trend slopes). Doubling times are marked in red and with an * in the table.
