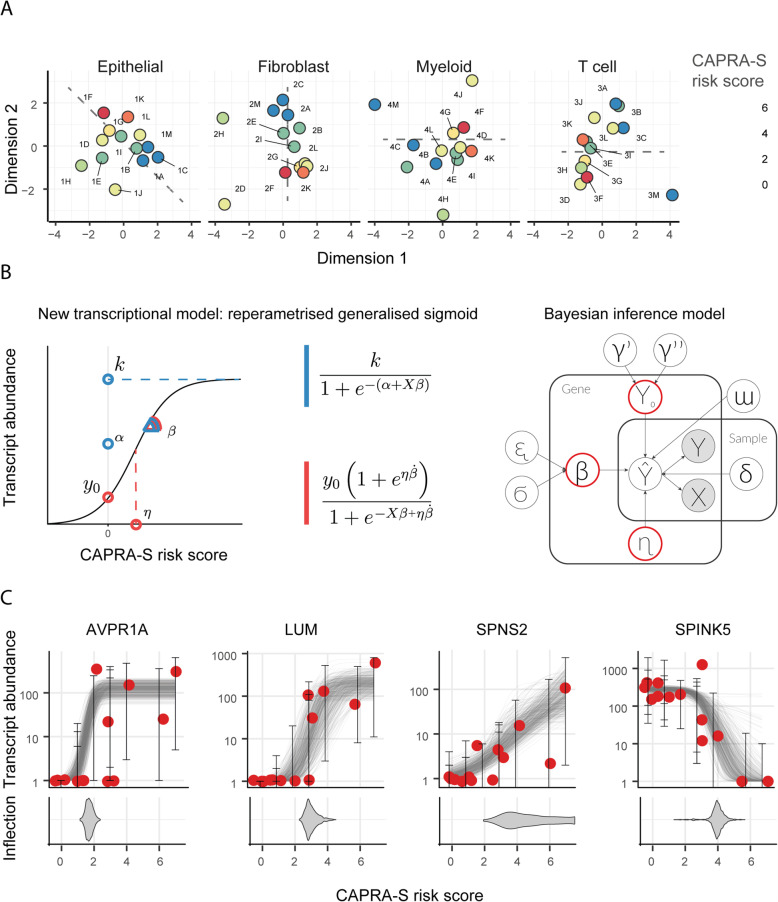
Fig. 1.
The continuous relationship between the CAPRA-S risk score and gene transcript abundance. A Multidimensional scaling plots of transcript abundance grouped by cell type. The colour coding represents the CAPRA-S risk score. The risk-score is correlated with the first and second dimension, particularly in epithelial and fibroblast cells (linear regression performed using lm in R; Bonferroni adjusted p-value of 0.0187, 0.00971, 0.0306 and 0.367, respectively). Alphanumeric codes refer to patient identifiers (Supplementary Table S1). The dashed lines indicate the correlation between the first and the second dimension with the CAPRA-S risk score. B Re-parameterisation of the generalised sigmoid function and probabilistic model (Material and Methods). Left-panel: The three reference parameters for the standard parameterisation (blue). Alternative robust parameterisation (red). Right-panel: a graphic representation of the probabilistic model TABI. C Examples of continuous relationships between transcript abundance of four representative genes and CAPRA-S risk score (for epithelial cell population), from more discrete-like to more linear-like. The bottom panel displays the inferred distribution of possible values (as posterior distribution) of the inflection point for each gene sigmoid trend

