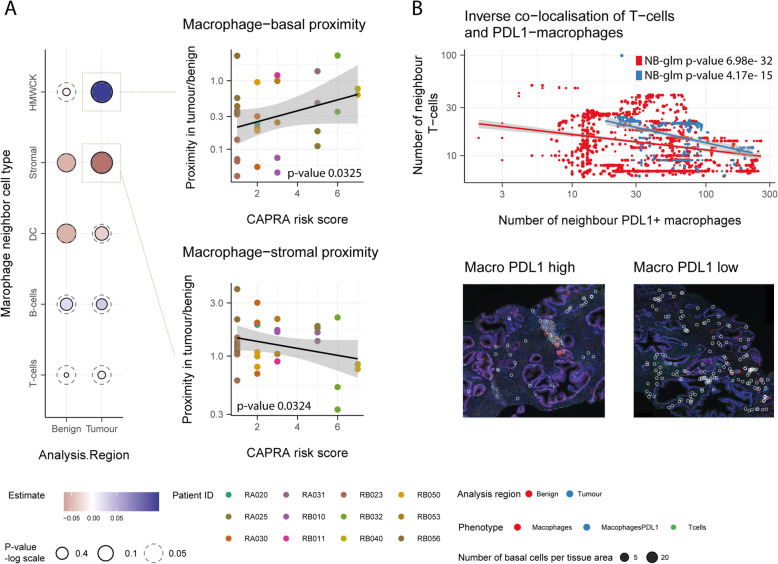
Fig. 5.
The analysis of multiplex-immunohistochemistry (n = 17) reveals proximity patterns of macrophages along disease progression. A Association between macrophage proximity and CAPRA risk score for five cell types identified from the multiplex immunohistochemistry. Proximity is calculated as the number of neighbour cells per tissue area and summarised using the median for each tumour biopsy. (left) Association between macrophages and epithelial basal cells (top) or stromal cells (bottom) and CAPRA risk score shown in panel (A). Only the 12 patients with both tumour and surrounding benign tissue are displayed (right). B Decreased proximity of T cells with epithelial basal in the presence of PDL1 expressing macrophages. The bottom section shows the multiplex immunohistochemistry tissue from patient RB010, with two examples of the presence (left) or absence (right) of PDL1 macrophages close to prostate glandulae. White circles surround the labelled T cells, blue and red circles surround macrophages which are PDL1 low and high, respectively

