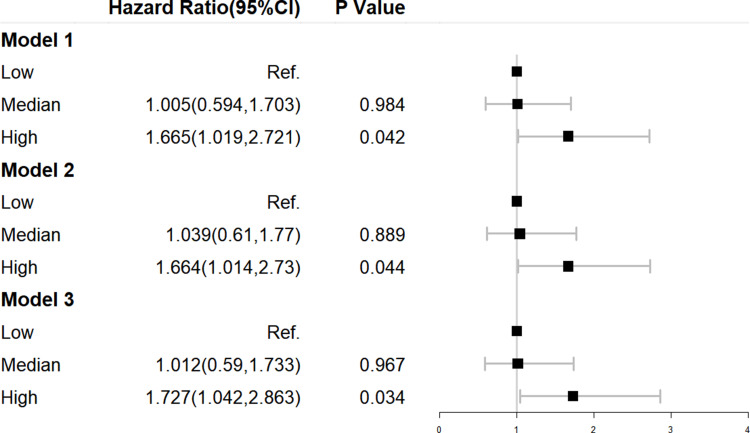
Figure 2.
Cox regression for DKD according to the tertiles of the TyG Index in longitudinal data. Model 1 was adjusted for age and sex. Model 2 was adjusted for the duration of diabetes mellitus, history of hypertension, and BMI in addition to the variables in model 1. Model 3 was adjusted for hypoglycemic therapy, hypolipidemic therapy, and anti-hypertension drugs in addition to the variables in model 2.

