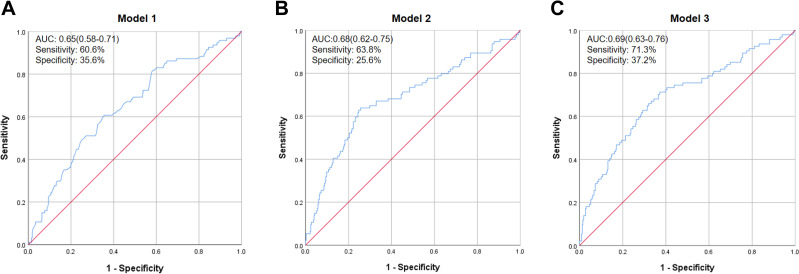
Figure 3.
Receiver–operator characteristic (ROC) curves of the TyG Index adjusted for different variables to predict DKD in longitudinal data. ROC curves of the TyG Index adjusted for different variables to predict DKD in longitudinal data. (A) Model 1 was adjusted for age and sex. (B) Model 2 was adjusted for the duration of diabetes mellitus, history of hypertension, and BMI in addition to the variables in model 1. (C) Model 3 was adjusted for hypoglycemic therapy, hypolipidemic therapy, and anti-hypertension drugs in addition to the variables in model 2.
Abbreviation: AUC, area under the curve.

