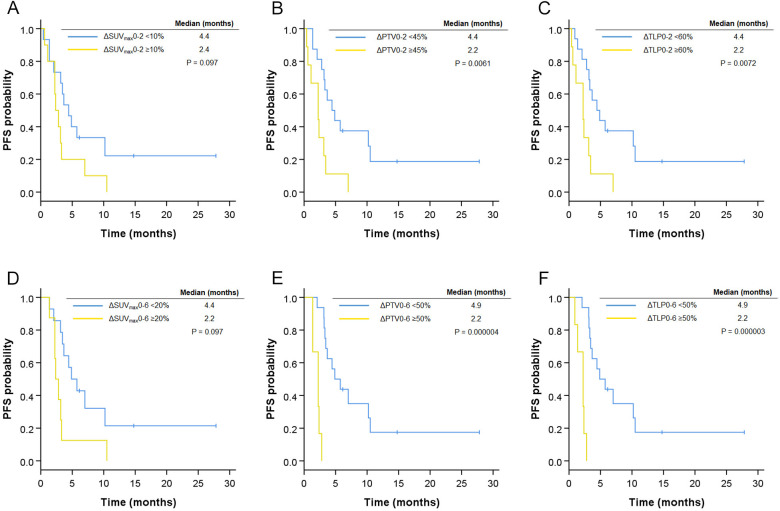
Figure 3.
Progression-free survival (PFS) of anti-PD-1 antibody-treated patients stratified by changes in 18F-FLT PET parameters. Kaplan–Meier curves of PFS stratified by changes between baseline and week 2 (n=25, ΔSUVmax0-2 (A), ΔPTV0-2 (B), ΔTLP0-2 (C)), and changes between baseline and week 6 (n=22, ΔSUVmax0-6 (D), ΔPTV0-6 (E), ΔTLP0-6 (F)) with cut-off values as determined by ROC curve analysis. 18F-FLT, 3′-deoxy-3′-[18F ]-fluorothymidine; PET, positron emission tomography; PTV, proliferative tumor volume; ROC, receiver operating characteristic; SUV, standardized uptake value; TLP, total lesion proliferation.

