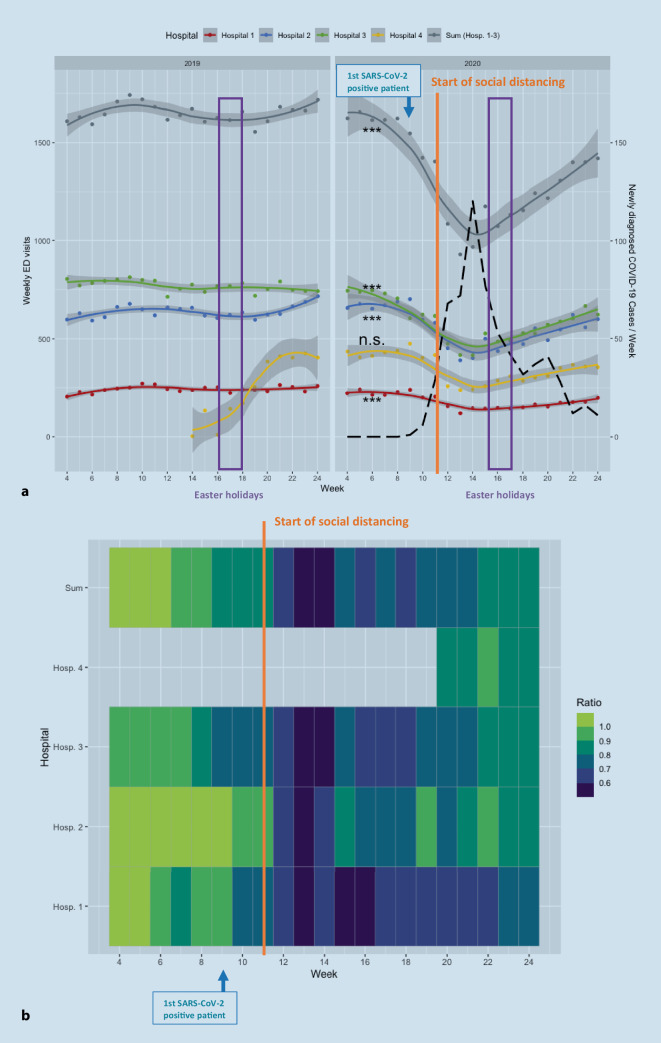
Fig. 1.
a Weekly numbers of ED visits for all four hospitals in 2019 (left) and 2020 (right). The plotted black line shows newly diagnosed COVID-19 cases per week. Hospital 4 is not included in the sum, because electronic data acquisition began in week 14 of 2019 (shaded gray 95% confidence interval). b Relative changes in ED visits as heatmap with ratio between 2020 and 2019 per week. The plotted black line shows newly diagnosed COVID-19 cases per week (*p < 0.05; **p < 0.01***p < 0.001; n. s. non-significant)

