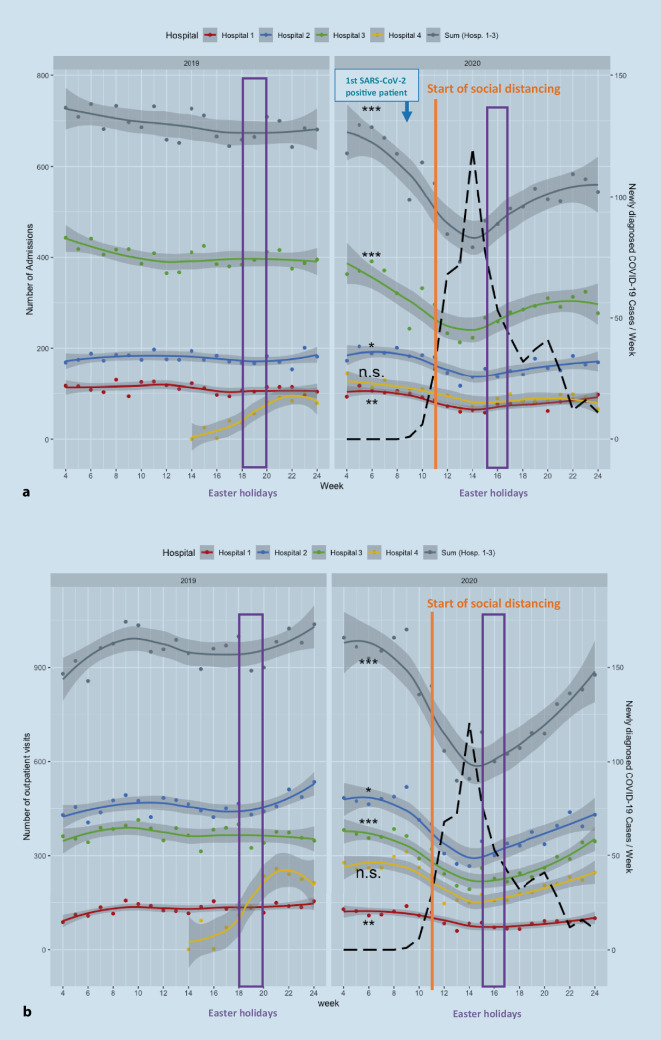
Fig. 2.
Weekly numbers of hospital admissions from the ED and numbers of outpatient cases in the ED for all four hospitals (sum of hospitals 1–3) in 2019 (left) and 2020 (right). Hospital 4 is not included in the sum, because electronic data acquisition began in week 14 of 2019. The plotted black line shows newly diagnosed COVID-19 cases per week. (shaded gray: 95% confidence interval; *p < 0.05; **p < 0.01***p < 0.001; n. s. nonsignificant)

