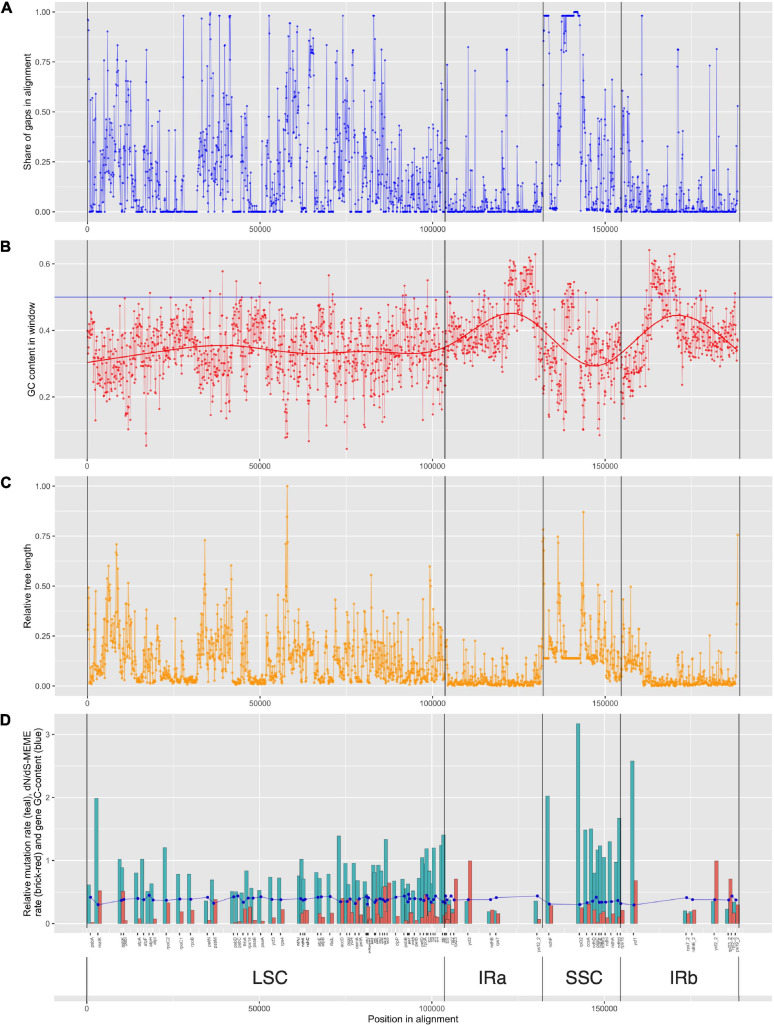
FIGURE 6.
Information on alignment and gene features. Structural components of plastome genomes and genes’ positions are shown [LSC, large single-copied region; SSC, small single-copied region; IRa and IRb, inverted repeats (A,B)]. (A) Share of gaps in alignment in the window of 100 bp. Dots are connected with a line for visibility. (B) GC-content in the window of 100 bp. Dots are connected with a line for visibility. A bold line shows regression estimating of GC-content. (C) Relative tree length. Dots are connected with a line for visibility. (D) Relative mutation rate (teal), Kn/Ks-MEME rate (brick-red) bar-plot and gene GC-content (blue). Dots are connected with a line for visibility.

