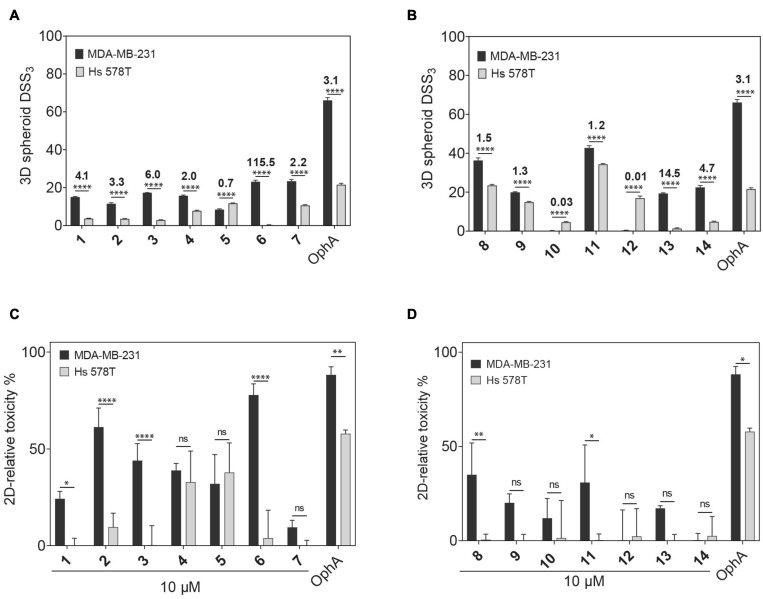
FIGURE 1.
Phenotypic assessment of anticlonogenic and cytotoxic activities of compounds. (A,B) A higher DSS3 reflects a more potent effect of formyl aminobenzazulenones (A) and aminobenzazulenones (B) tested at a concentration range of 0.6–40 μM on KRAS-mutant MDA-MB-231 and HRAS-mutant Hs 578T 3D spheroid formation in low attachment condition without serum. Data represent mean values ± SD, n ≥ 3. Numbers above the bars indicate the KRAS/HRAS mutant cell line DSS3 ratios. (C,D) The relative toxicity of formyl aminobenzazulenones (C) and aminobenzazulenones (D) was assessed in the CellTox Green assay. Cells were grown as 2D adherent monolayers overnight and then treated for 72 h with 1 μM OphA or 10 μM of the indicated benzazulenones. Data represent mean values ± SD, n ≥ 2. The statistical significance levels are annotated as *p < 0.05; **p < 0.01; ****p < 0.0001, or ns, not significant.

