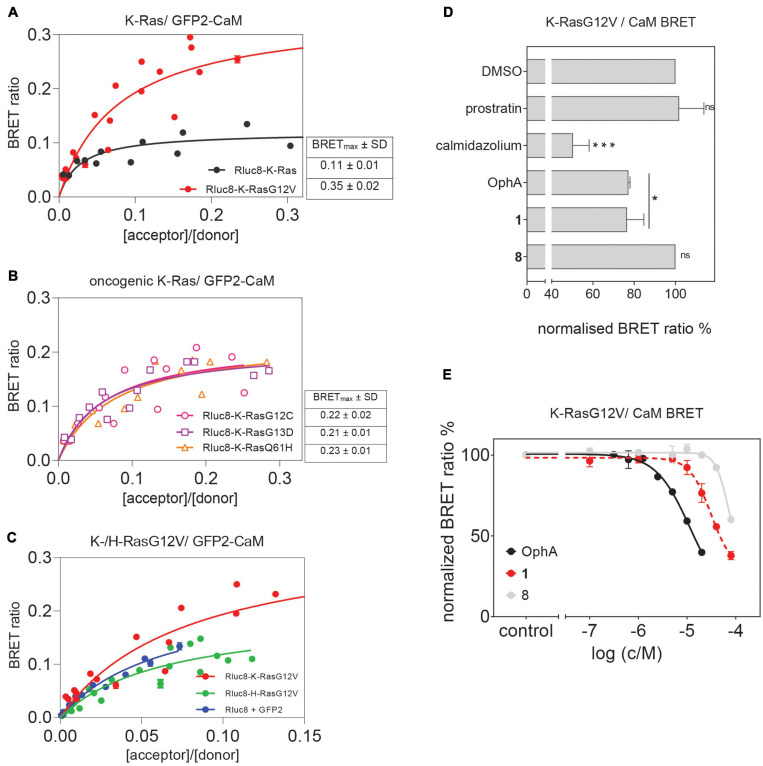
FIGURE 4.
Cellular K-RasG12V/CaM interaction BRET confirms on-target activity of compound 1 in cells. (A) BRET donor saturation titration curves between Rluc8-K-Ras or Rluc8-K-RasG12V and N-terminally GFP2-tagged CaM. (B) BRET donor saturation titration curves between the Rluc8-tagged K-Ras oncogenic mutants (K-RasG12C, K-RasG13D, and K-RasQ61H) with GFP2-CaM. The BRETmax data represent mean values ± SD, n ≥ 2. (C) BRET donor saturation titration curves between Rluc8-K-RasG12V or Rluc8-H-RasG12V and GFP2-CaM. Plasmids expressing Rluc8 and GFP2 proteins alone were used as controls for non-specific interaction. (D) Compounds calmidazolium (20 μM), prostratin (20 μM), or OphA (5 μM), as well as formyl aminobenzazulenone 1 (20 μM) or non-formylated counterpart aminobenzazulenone 8 (20 μM) were tested using the Rluc8-K-RasG12V/GFP2-CaM BRET reporter. The A/D plasmid ratio was 9/1. Data represent mean values ± SD, n ≥ 2. (E) Dose-response analysis of compound 1 and its non-formylated derivative 8 as compared to OphA using Rluc8-K-RasG12V/GFP2-CaM BRET signal. The A/D plasmid ratio was 9/1. Data represent mean values ± SD, n ≥ 2. The statistical significance levels are annotated as *p < 0.05; ***p < 0.001, or ns, not significant.

