FIGURE 7.
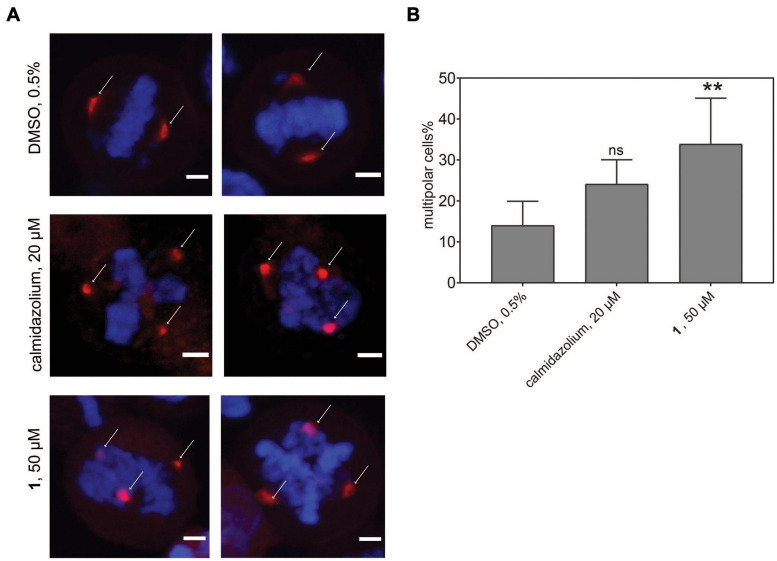
Phenotypic effects of CaM inhibitors on centrosome numbers. (A) Representative images for bipolar normal (DMSO 0.5%, top) and multipolar centrosomes in HeLa cells after acute treatment for 2 h with calmidazolium (20 μM, middle) 1 (50 μM, bottom). Hela cells expressing mCherry-wtCaM (red) cells were synchronized with nocodazole to the G2/M phase for 16 h. Then cells were treated with compounds and simultaneously with the protease inhibitor MG132 (10 μM). Arrows indicate predominant localization of mCherry-wtCaM on the centrosomes during mitosis. DNA was stained with DAPI (blue). Scale bar, 5 μm. (B) The multipolar phenotype was quantified for each treatment from images containing 35 to 70 cells per condition. Data represent mean values ± SD, n = 3. Statistical significance was evaluated with Fisher’s exact test. The statistical significance levels are annotated as **p < 0.01, or ns, not significant.

