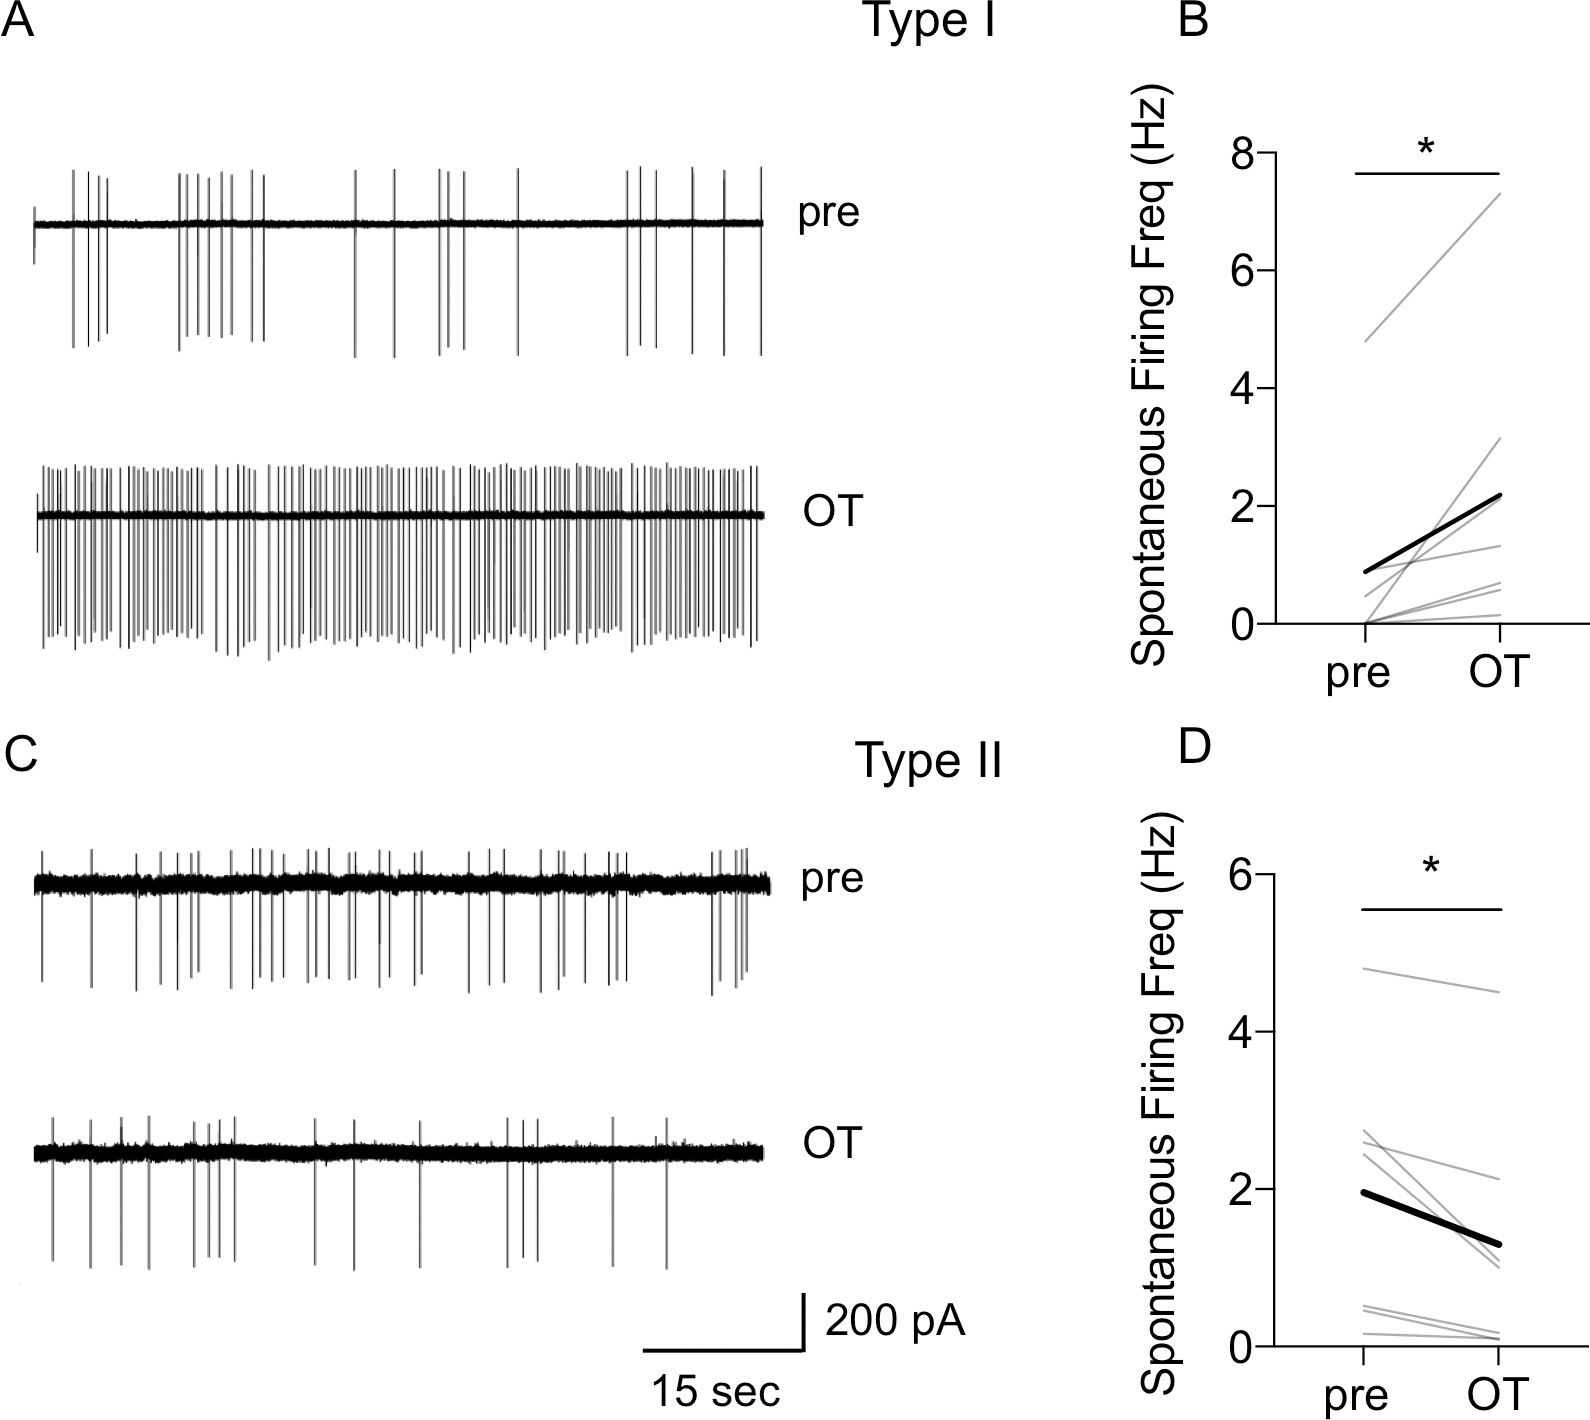
Figure 4. Oxytocin increases spontaneous firing rate of Type I neurons and reduces spontaneous firing rate of Type II BNSTDL neurons in cell-attached recordings.

A: Representative traces of Type I neuron showing an increase in spontaneous firing rate after OT application. B: Line graph showing that OT increased spontaneous firing rate in all spontaneously firing Type I neurons (P = 0.0242, paired t-test, n = 7). C: Representative traces of Type II neuron showing a reduction in spontaneous firing rate after OT application. D: Line graph showing that OT significantly reduced spontaneous firing rate in spontaneously firing Type II neurons in cell-attached mode (P = 0.0304, paired t-test, n = 7), gray lines represent individual neurons’ responses, thick black line represents average response, *P < 0.05.
