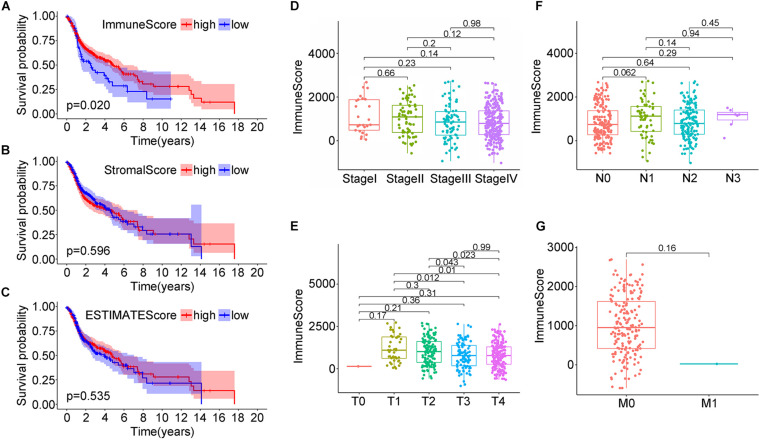
FIGURE 1.
Correlation analysis of head and neck squamous cell carcinoma (HNSC) patients survival and stromal score/immune score/estimate score distribution from the TCGA database. (A–C) Kaplan–Meier survival analysis for HNSC patients grouped by immune score, stromal score, and estimate score. (D–G) Distribution of immune score in clinical stage, T classification, N classification, and M classification.

