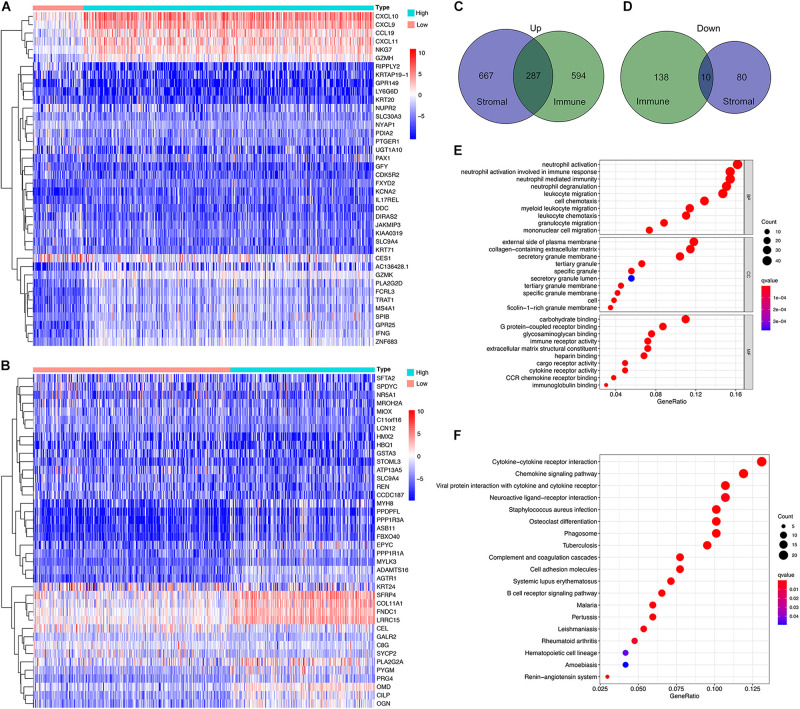
FIGURE 2.
Profile of differential expressed genes (DEG)s and functional enrichment analysis based on the stromal and immune scores. (A,B) Heatmap for DEGs generated by comparing the high score with low score group for Immune Scores and Stromal Scores. The row name of the heatmaps is the gene name. (C,D) Common up-regulated, and down-regulated DEGs shared by Immune Score and Stromal Score in the Venn plots. (E,F) GO and KEGG enrichment analysis for DEGs.

