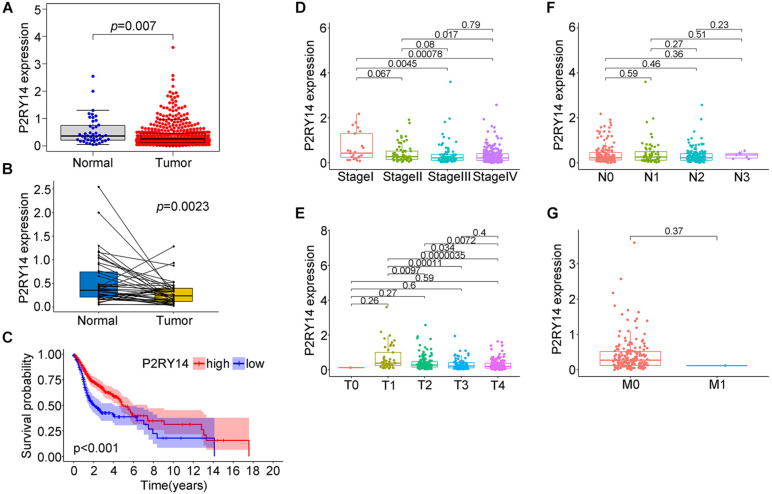
FIGURE 4.
Expression of P2RY14 in samples of HNSC patients from the TCGA database and its correlation with survival and TNM staging distribution. (A) Differentiated expression of P2RY14 in normal and tumor samples. (B) Paired differentiation analysis of P2RY14 in the normal and tumor sample derived from the same patient. (C) Survival analysis for HNSC patients with different P2RY14 expression. (D–G) Distribution of P2RY14 expression level in clinical stage, T classification, N classification, and M classification.

