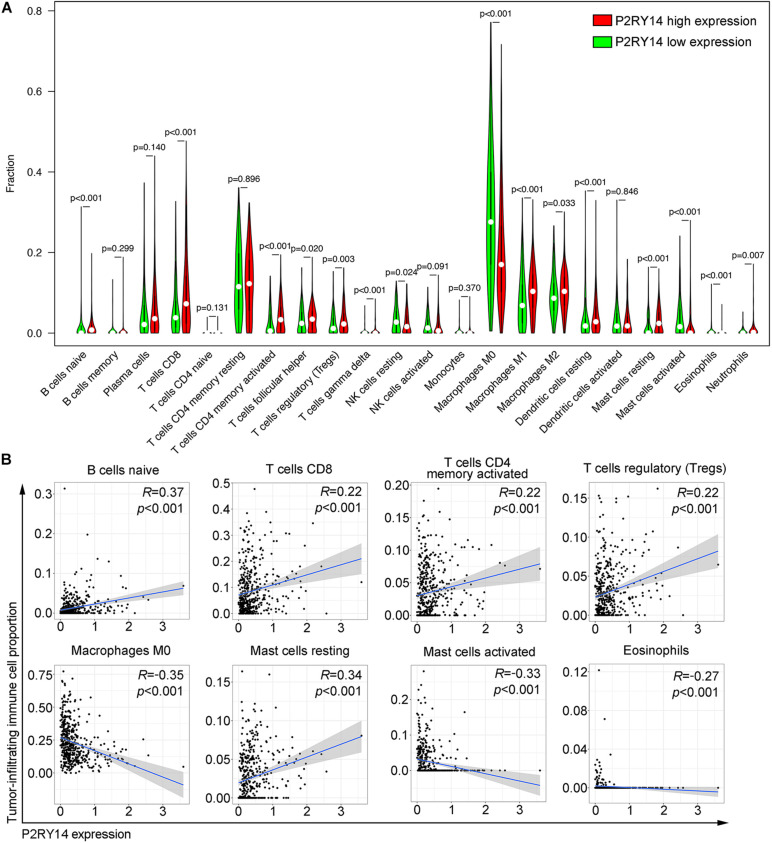
FIGURE 6.
Correlation of tumor-infiltrating immune cells proportion with P2RY14 expression. (A) Violin plots showing the ratio differentiation of 22 kinds of immune cells between HNSC tumor samples with high or low P2RY14 expression. (B) Scatter plot showing the correlation of eight kinds of tumor-infiltrating immune cells proportion with the P2RY14 expression.

