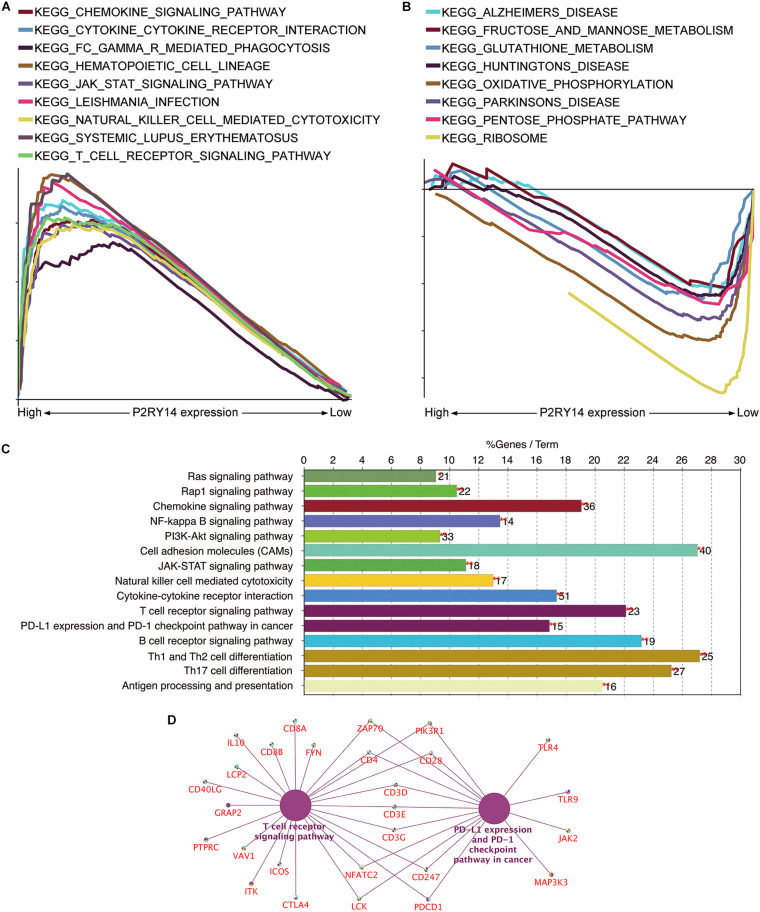
FIGURE 7.
Analyses of the functional role of P2RY14 gene in the tumor microenvironment (TME) and the underlying regulatory genes in HNSC. (A,B) The enriched gene sets in HALLMARK by the samples with high or low P2RY14 expression. (C) KEGG pathway analysis of the genes co-expressed with P2RY14. (D) The genes co-expressed with P2RY14 in the T-cell receptor signaling pathway and PD-L1 expression and PD-1 checkpoint pathway in cancer.

