
Fig. 4 |. Molecular rearrangements of the membrane-penetration protein during rotavirus entry.
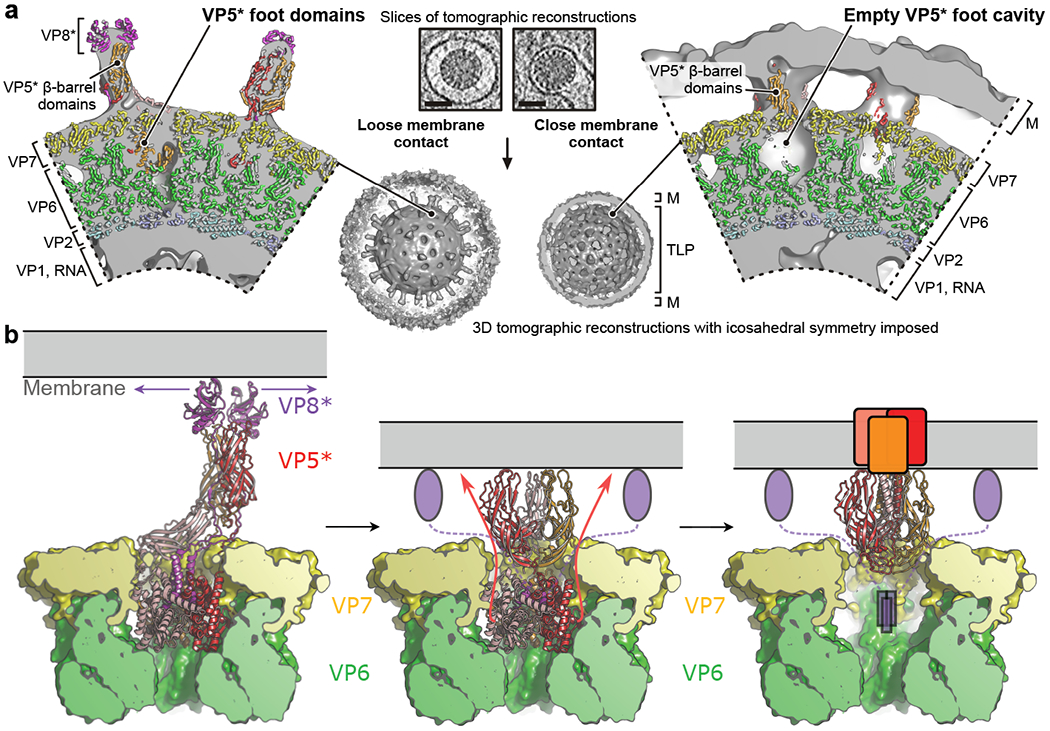
a, Cryo-ET reconstructions of RRV entering at the thin edge of BSC-1 cells. Tomographic analysis is shown for two viral particles that are representative for a “loose” (left) or “tight” (right) virion-membrane (M) interface, respectively. In the close-up views of the tomographic reconstructions, density is partially cut and shown in solid gray; protein subunits of positioned atomic models are shown in ribbon representation and colored as in Fig. 1. The scale bar in the tomographic slices (low-pass filtered and contrast-enhanced) is 50 nm. b, Model for VP5* and VP8* rearrangement and membrane-interaction; see Discussion for details.