
Extended Data Fig. 4 |. cryo-EM density and structure comparison.
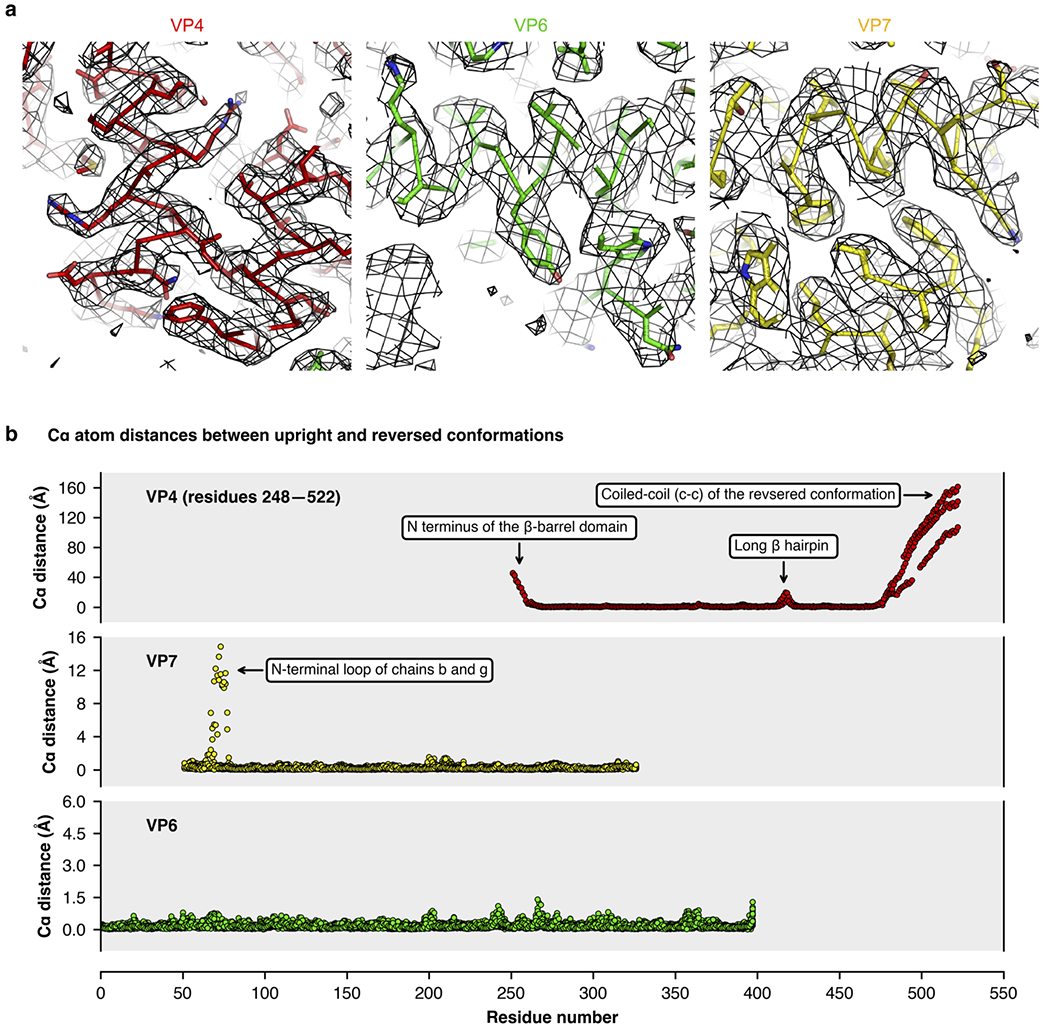
a, Close-up views of representative regions of the cryo-EM density maps obtained by local reconstruction. Density is shown as gray mesh; polypeptide-chain backbone as ribbon; side-chain atoms as sticks (carbon, black; nitrogen, blue; oxygen, red; sulfur, orange). b, Per-residue Cα distances after subunit-vise superposition of V4, VP7, and VP6 subunits from the upright and reversed conformation structures.