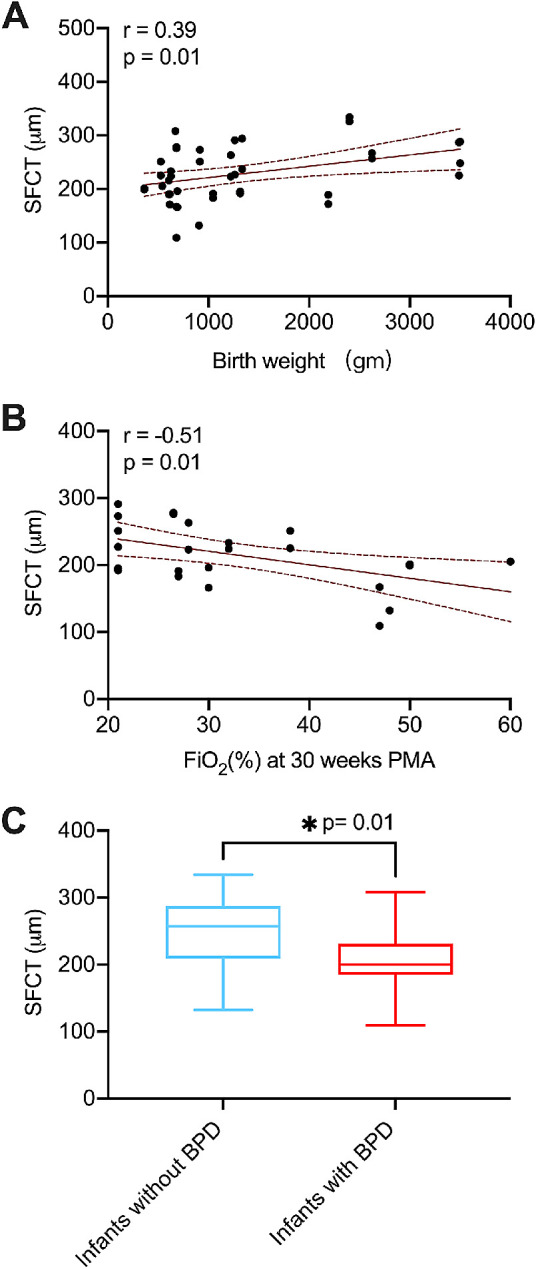
Figure 2.

Clinical factors associated with SFCT. (A) Scatterplot shows correlation of SFCT thickness with birth weight and fraction of inspired oxygen (FiO2) at 30 weeks PMA. The curved dotted lines represent the 95% CIs for the trend line. SFCT was positively correlated with birth weight. (B) SFCT was inversely correlated with FiO2 at 30 weeks PMA. (C) Infants with BPD had thinner SFCT when compared with infants without BPD.
