Figure 3.
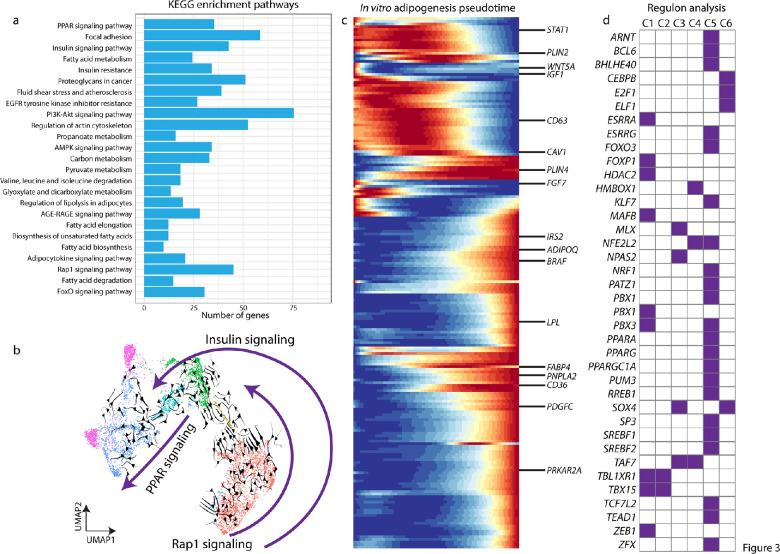
snRNA-Seq reveals adipogenesis signaling pathway. (a) KEGG plot based on pseudotime analysis from snRNA-Seq data in Figure 2. (b) UMAP plot with RNA velocity showing adipocyte differentiation trajectory, and three pathways that are specific across differentiation stages. (c) Pseudotime trajectory of adipogenesis and key genes. (d) Regulon analysis demonstrates key transcription factors that might be involved in each step of adipogenesis differentiation.

