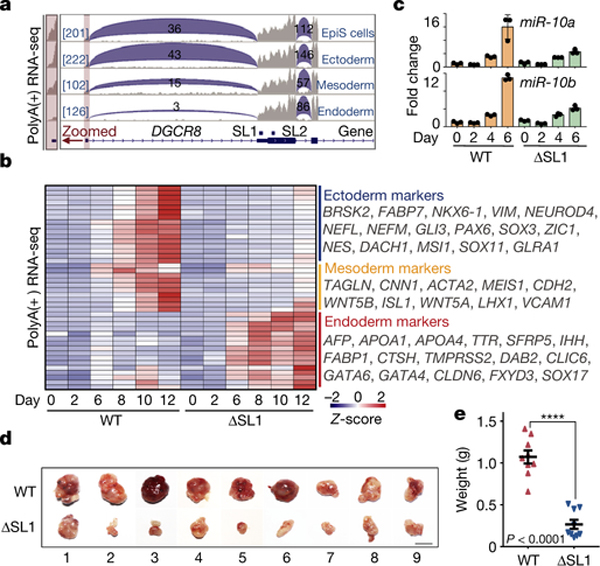
Fig. 3 |. ATI-mediated miRNA dosage control determines germ layer specification during ESC differentiation.
a, Box plots of the relative expression of naïve and primed genes during EpiLC differentiation of WT, ΔSL1 and DGCR8-\- mESCs. The number of naïve and primed genes is shown and representative markers are listed. b, Sequencing reads mapping to 5’-end of DGCR8 mRNA from PolyA(+) RNA-seq on EpiSC and three embryonic germ layers derived from mESCs. Regions containing the first exon are zoomed in. Reads number of exon junctions (above the arcs) and sequencing abundance (in brackets) are indicated. c, Heatmap of gene expression showing up- or downregulation in ΔSL1 cells compared with WT cells during mESC-to-neural progenitor differentiation. The enrichment of Gene Ontology (GO) terms and the number of genes in each group are shown. d, Heatmap of the expression of marker genes for three germ layers during EB differentiation. Representative genes are listed on the right. e, q.RT-PCR analysis of the expression of miR-10a and −10b during neural differentiation. Data were normalized to U2 snoRNA. Data are represented as mean +/− SD. f, Morphology of teratomas derived from WT and ΔSL1 mESCs in 9 donor mice. g, The weight of teratomas in f is shown. Data are represented as mean +/− SEM (N=9). p<0.0001, Two-tailed Student’s t-test. h, Comparison of the relative area of ectoderm and endoderm tissues between WT and ΔSL1 teratomas. The beeswarm plot showing relative area of ectoderm and endoderm tissues compared to the total area according to the HE staining. 16 (WT:8, ΔSL1:8) sections of 8 (WT:4, ΔSL1:4) teratomas from 4 mice are used for analysis. Data are represented as mean +/− SEM. **p<0.01, ****p<0.0001, Two-tailed Student’s t-test.

