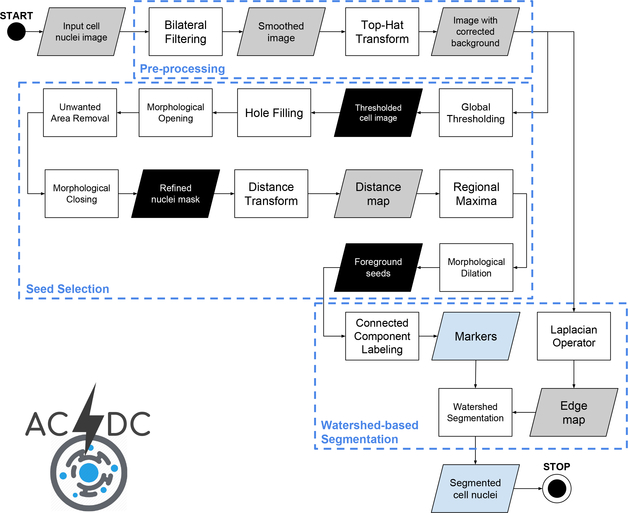
Figure 4.
Flow diagram of the ACDC pipeline. The gray, black and light-blue data blocks denote gray-scale images, binary masks and information extracted from the images, respectively. The three macro-blocks represent the three main processing phases, namely: pre-processing, seed selection, and watershed-based segmentation.

