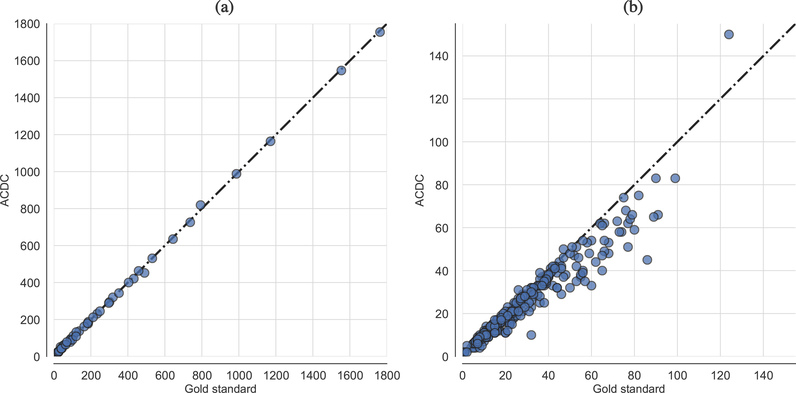
Figure 9.
Scatter plots depicting ACDC results compared to the gold standard in terms of cell nuclei counting in the case of: (a) time-lapse fluorescence images from the VU dataset; (b) small fluorescent nuclei images from the DSB dataset. The equality line through the origin is drawn as a dashed line.

