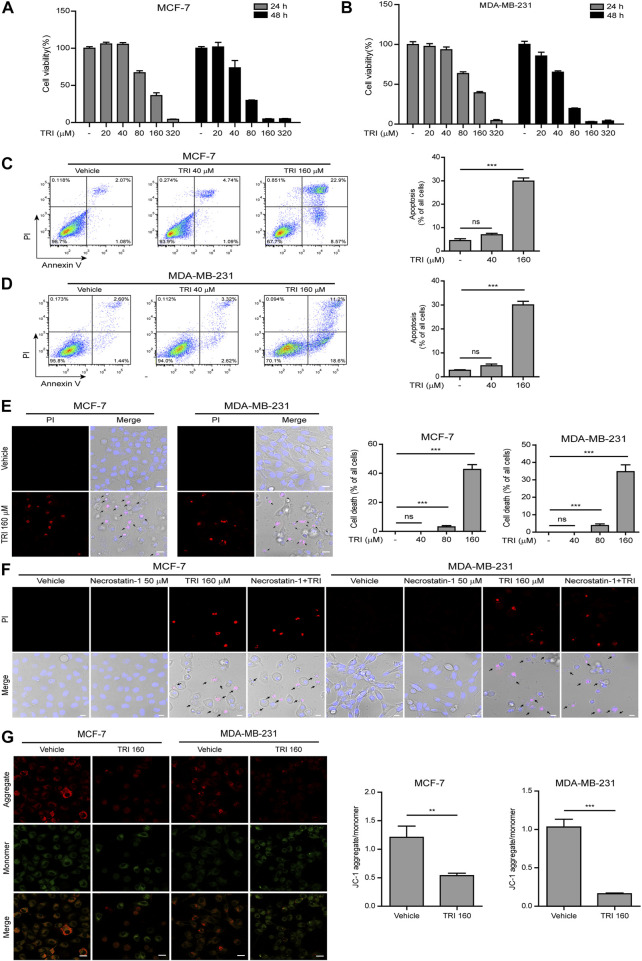
FIGURE 1.
Triclabendazole induces apoptosis and lytic death in breast cancer cells. (A, B) The cell viability is measured by the CCK-8 assay. The MCF-7 (C) or MDA-MB-231 (D) cells are treated with indicated concentrations of triclabendazole (TRI) for 24 h. The cells are stained with annexin V-FITC and PI and then analyzed by flow cytometry. The ratios of cells are shown in each quadrant of representative dot plots of flow cytometry (on the left), and quantitative analysis of the ratios of apoptotic cells and necrotic/pyroptotic cells is shown on the right. Data are shown as mean ± SD (n = 3). (E, F) The cells are treated as in (C, D), respectively, stained with PI solution containing 2 μg/ ml propidium iodide (PI; red, staining dying cells) plus 5 μg/ ml Hoechst 33342 (blue, staining all cells) for 10 min, and then observed by the Leica confocal microscope; the black arrow indicates lytic cells (necrotic or pyroptotic) with large bubbles blowing from the cellular membrane. Scale bars: 10 µm. (G) The mitochondrial membrane potential is determined by the JC-1 assay. The cells are observed by the Leica confocal microscope, and representative images are shown. Scale bars: 10 µm. Statistical analysis is performed by one-way ANOVA with Tukey’s multiple comparisons test. **p < 0.01; ***p < 0.001; ns, not significant; TRI, triclabendazole.

