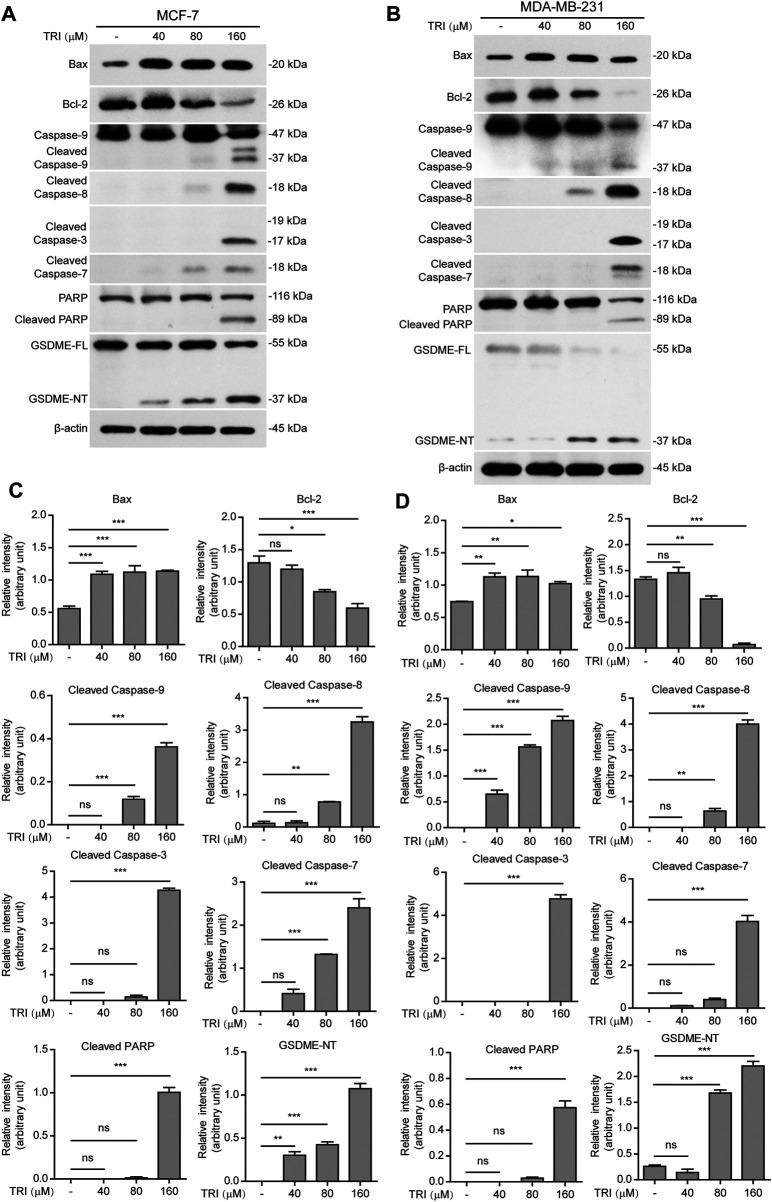
FIGURE 2.
Western blot analysis of apoptotic and lytic cell death markers in breast cancer cells treated with triclabendazole. MCF-7 and MDA-MB-231 cells are treated with indicated concentrations of triclabendazole for 24 h. (A, B) Markers of apoptosis and lytic cell death are detected by western blotting. The β-actin is recruited as a loading control. (C, D) Relative gray values of Bax, Bcl-2, cleaved caspase-9, cleaved caspase-8, cleaved caspase-3, cleaved caspase-7, cleaved PARP, and GSDME-NT blots are quantified in (A, B), respectively. Data are shown as mean ± SD (n = 3). Statistical analysis is performed by one-way ANOVA with Tukey’s multiple comparisons test. *p < 0.05; **p < 0.01; ***p < 0.001; ns, not significant; TRI, triclabendazole.

