FIGURE 3.
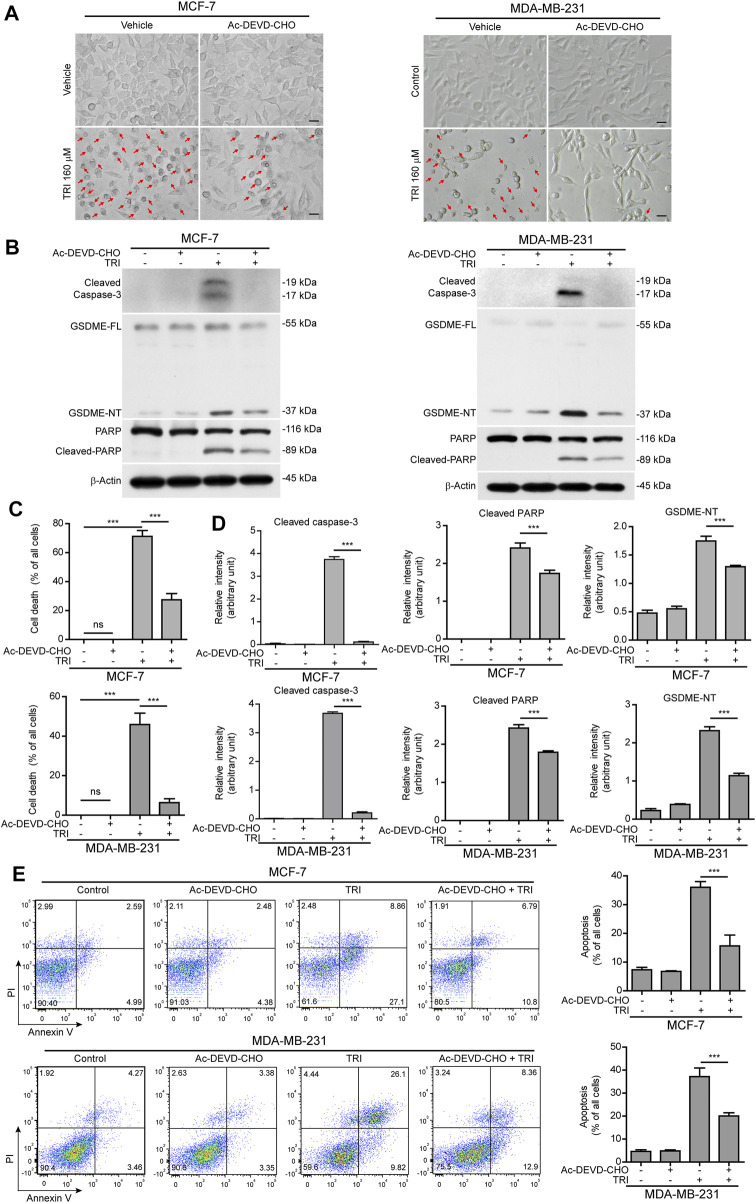
Blockade of caspase-3 activity suppresses triclabendazole-induced lytic cell death in breast cancer cells. MCF-7 and MDA-MB-231 cells are pre-treated with the caspase-3 inhibitor Ac-DEVD-CHO (DEVD) for 1 h and then treated with triclabendazole for 24 h. (A) The cells are observed immediately by live imaging using fluorescence microscopy, and representative bright-field images are shown. The red arrow indicates lytic cells (necrotic or pyroptotic) with large bubbles blowing from the cellular membrane. Scale bars: 20 µm. (B) Representative western blots for markers of apoptosis and lytic cell death including cleaved caspase-3, cleaved PARP, and GSDME-NT. The β-actin is recruited as a loading control. (C) The ratio of lytic cell death (necrosis or pyroptosis) in five randomly chosen fields with each containing ∼50 cells is quantified to (A). Data are shown as mean ± SD (n = 5). (D) Histograms showing the relative gray values of cleaved PARP and GSDME-NT in (B). (E) Cells are stained with annexin V-FITC and PI and then analyzed by flow cytometry. Quantitative analysis of the ratios of apoptotic cells and necrotic/pyroptotic cells is shown on the right. Statistical analysis is performed by one-way ANOVA with Tukey’s multiple comparisons test. ***p < 0.001; ns, not significant; TRI, triclabendazole.

