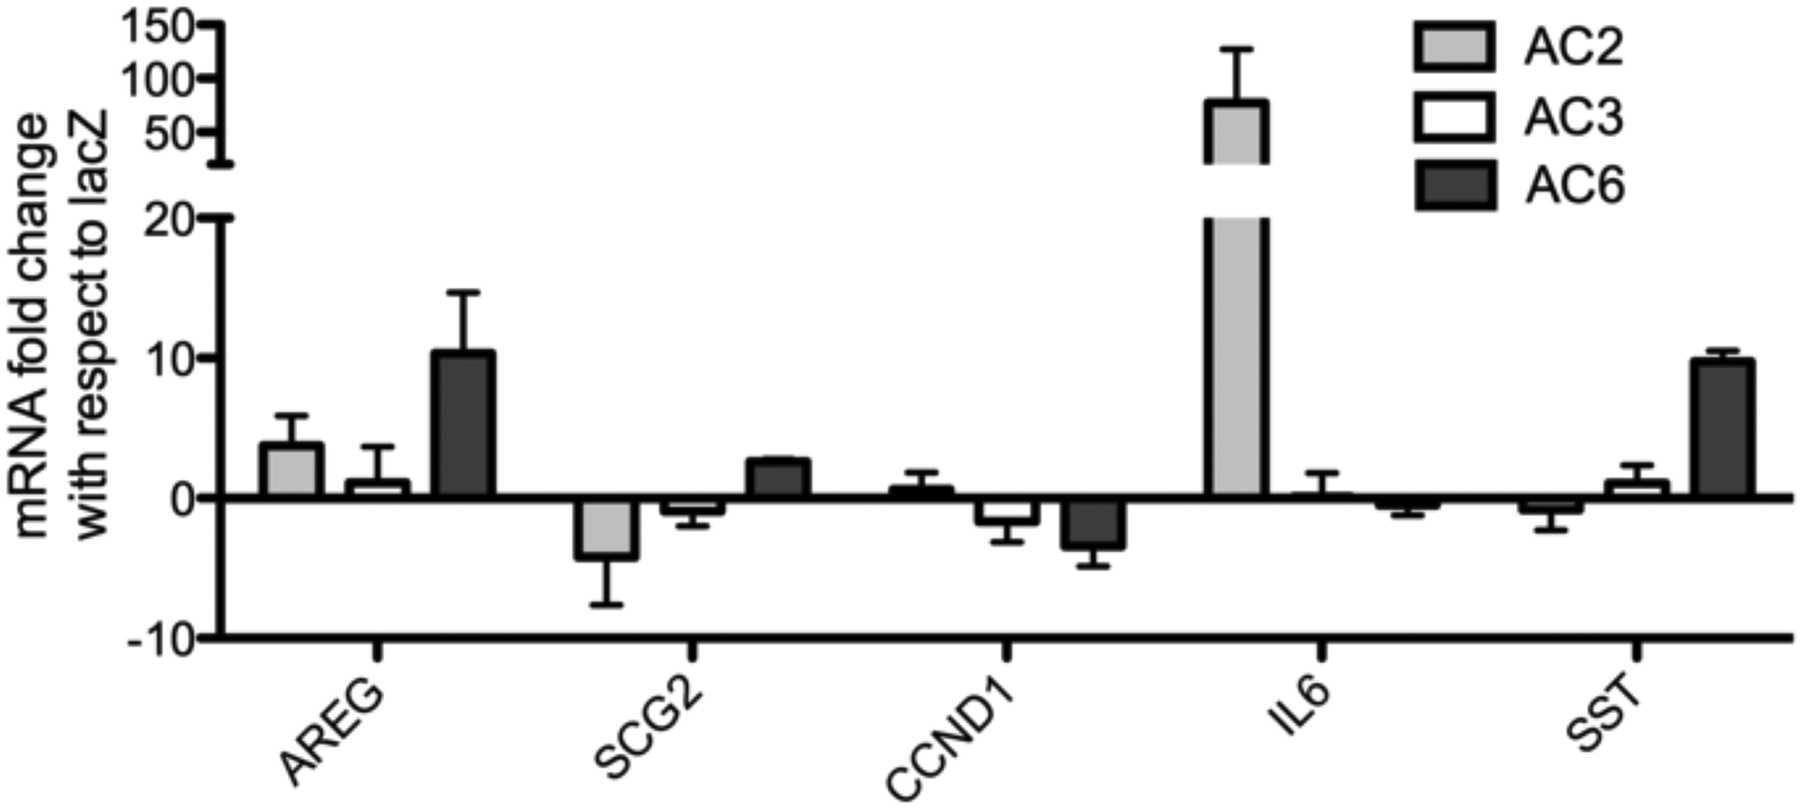
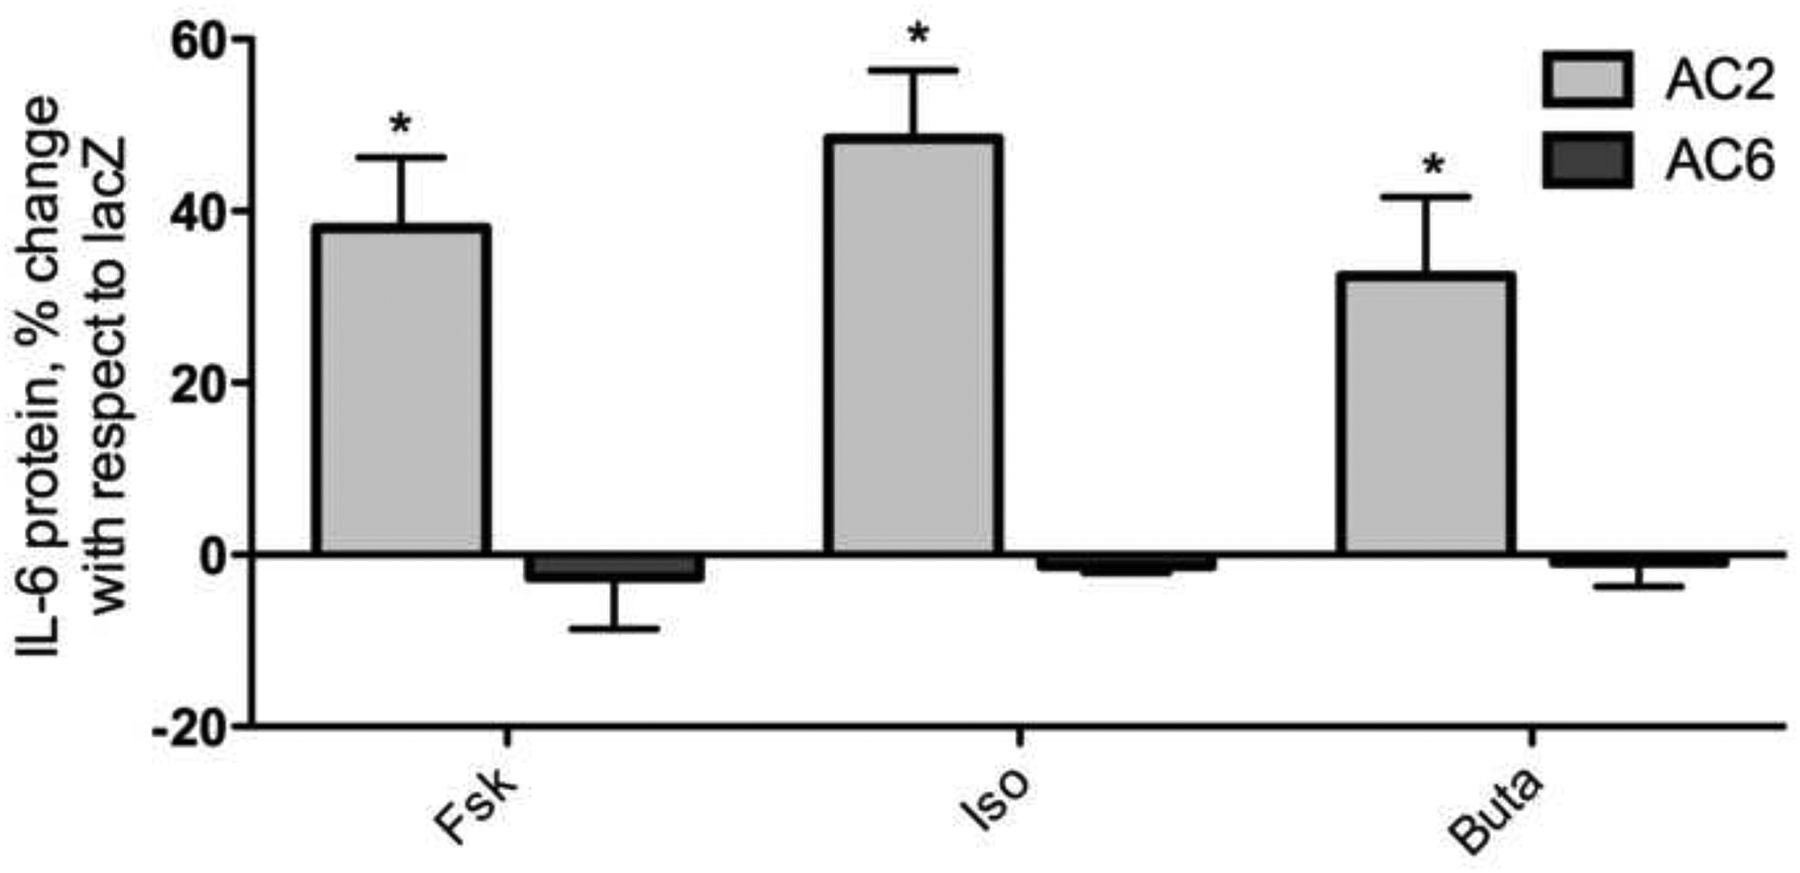
Fig. 2.


a: Fsk-induced gene regulation in AC overexpressing BSMC compared to control BSMC. RT2 q PCR arrays (SA Biosciences) were used to measure mRNA levels following 24 h treatment with 1μM Fsk. mRNA levels of AC overexpressing, Fsk-treated cells are expressed as fold change with respect to lacZ (control), Fsk- treated. Amphiregulin (AREG), Secretogranin II (SCG2), Cyclin D1 (CCND1), Interleukin 6 (IL-6), Somatostatin (SST). Data are presented as fold change over lacZ, mean ± SEM, n=3. b: IL-6 protein production in AC2 or AC6 overexpressing BSMC. IL-6 protein in cell culture media was measured by ELISA following 24 h treatment with 1 μM of the indicated drug. Data are presented as % change with respect to lacZ, mean ± SEM, n=3. * indicates p<.05 compared to lacZ
