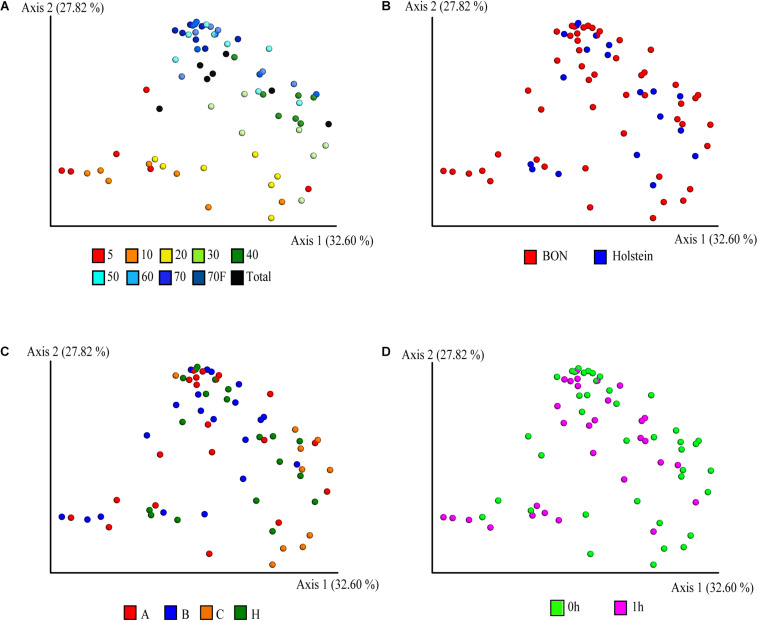
FIGURE 2.
Principal coordinate analysis (PCoA) of the fractionation of the ruminal microbial community based-on weighted UniFrac distances. Distribution of the community in the samples is depicted according to (A) sucrose concentration, (B) breed, (C) animals, where A, B, C, and H represent BON-A, BON-B, BON-C, and Holstein respectively, and (D) sampling at fasting and post feeding.

