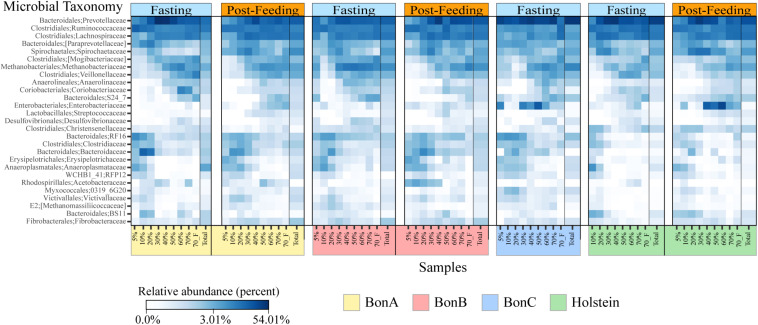
FIGURE 4.
Heatmaps depicting relative abundance of the bacterial families across the sucrose density gradient fractions and the total sample for the BON-A (A), BON-B (B), BON-C (C), and Holstein (D) at the time of fasting and post feeding. Note that no post-feeding sample was obtained for the BON-C. Relative abundance (percentage) is shown in a log scale to help visualize changes in the community composition of families that are not highly abundant. Families present in the four animals are highlighted in red. A black line divides the Total sample from each of the fractions.

