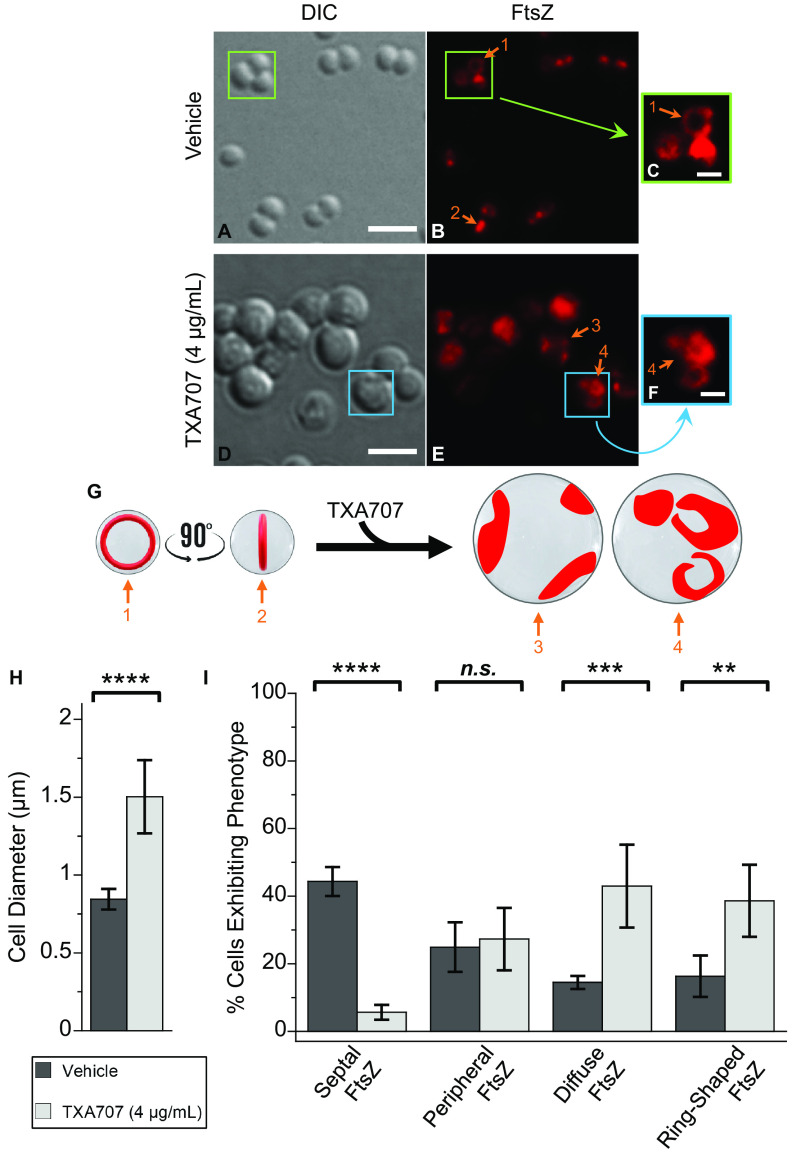
FIG 1.
Differential interference contrast (DIC) and fluorescence micrographs of MRSA LAC-FCh cells treated for 3 h with either DMSO vehicle (A to C) or 4 μg/ml (4× MIC) TXA707 (D to F) just prior to visualization. (C and F) Enlargements of the regions enclosed by the green and cyan boxes in panels B and E, respectively. (G) Localization of FtsZ (red) is schematically depicted, with the numbered arrows in the schematic depiction reflecting the correspondingly numbered arrows in the fluorescence micrographs. The scale bars for panels A to B and D to E represent 2 μm, while those for panels C and F represent 0.5 μm. (H) Bar graph showing the average diameter of the vehicle-treated cells (n = 641) as well as the TXA707-treated cells (n = 349). (I) Bar graph showing the prevalence of the various FtsZ phenotypes observed in both vehicle- and TXA707-treated cells. Each percentage reflects an average of 5 different fields of view, with the number of cells in each field of view ranging from 56 to 171. In both panels H and I, the indicated error bars reflect the standard deviation from the mean. The statistical significance of differences in cell diameter and FtsZ phenotype were analyzed using a one-way analysis of variance (ANOVA) test. For all figures: ****, P < 0.0001; ***, 0.0001 < P < 0.001; **, 0.001 < P < 0.01; *, 0.01 < P < 0.1.; n.s., not significant, as reflected by a P value of >0.1.

