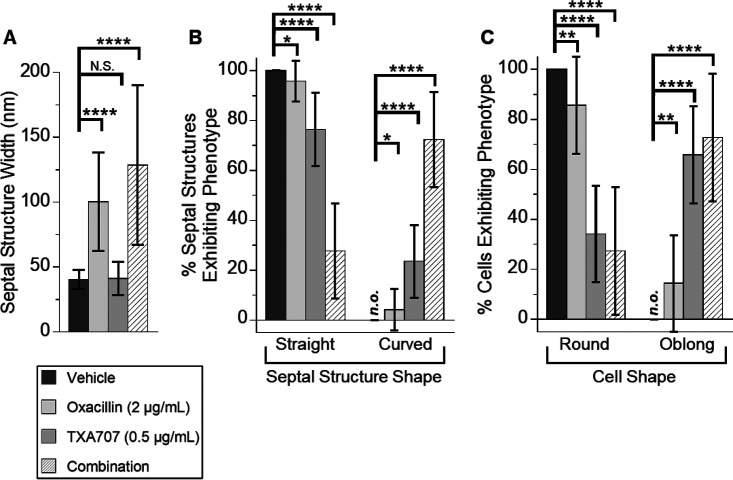
FIG 10.
Quantification of septal structure width (A), septal structure phenotype (B), and cell shape (C) for the results of the TEM experiments depicted in Fig. 9. (A) Bar graph showing the average septal structure width with vehicle treatment (n = 55), oxacillin treatment (n = 72), TXA707 treatment (n = 78), or treatment with a combination of both oxacillin and TXA707 (n = 106). (B) Bar graph showing the prevalence of the septal structure phenotype (straight versus curved) observed in the different treatment groups. (C) Bar graph showing the prevalence of the cell shape (round versus oblong) observed in the different treatment groups (n = 55 for vehicle, n = 56 for oxacillin alone, n = 42 for TXA707 alone, and n = 53 for the combination). In both panels B and C, each percentage reflects an average of 14 to 18 different fields of view, with the indicated error bars reflecting the standard deviation from the mean. The statistical significance of differences in septal structure width, septal structure phenotype, and cell shape were analyzed as described in the legend to Fig. 1. n.s., not significant; n.o., none observed.

