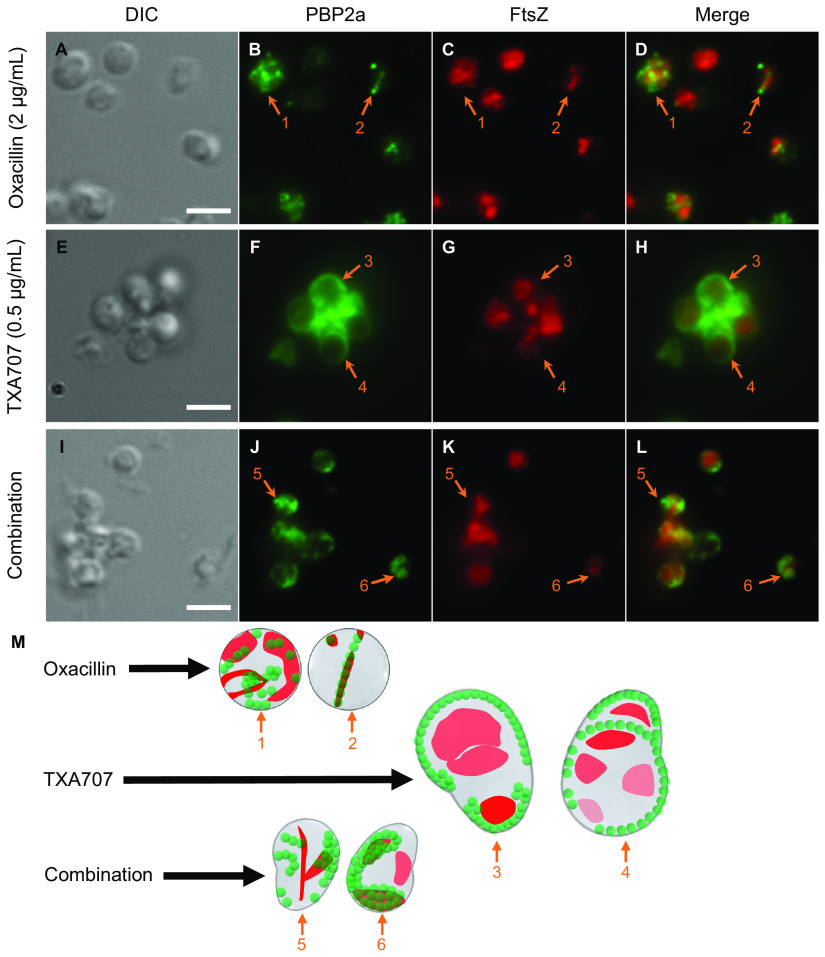
FIG 7.
(A to L) DIC and fluorescence micrographs of MRSA LAC-FCh cells treated for 3 h with either 2 μg/ml (1/32× MIC) oxacillin (A to D), 0.5 μg/ml (1/2× MIC) TXA707 (E to H), or a combination of 2 μg/ml oxacillin and 0.5 μg/ml TXA707 (I to L), followed by immunostaining of PBP2a as described in the legend to Fig. 6. (M) Localization of PBP2a (green) and FtsZ (red) is schematically depicted, with the numbered arrows in the scheme reflecting the correspondingly numbered arrows in the florescence micrographs. Scale bars for panels A to L represent 2 μm.

