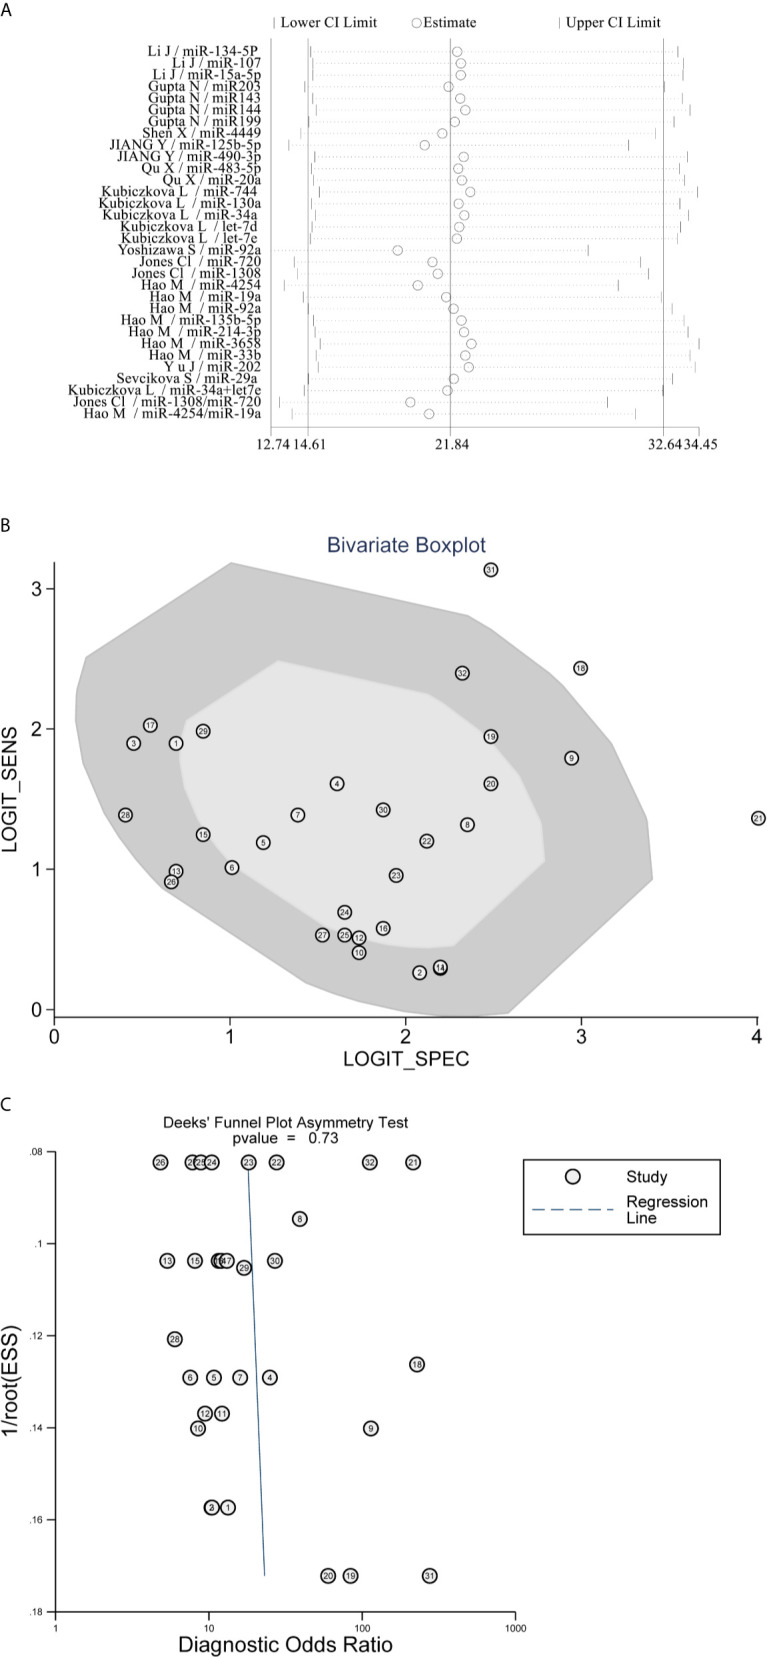
Figure 5.

Sensitivity analysis and Heterogeneity exploration. (A) Sensitivity Analysis showed that the combination results were stable; (B) Bivariate Boxplot revealed that No.18/21/31 studies presented strong heterogeneity; (C) Deek’s Funnel Plot Asymmetry Test found no publication bias.
