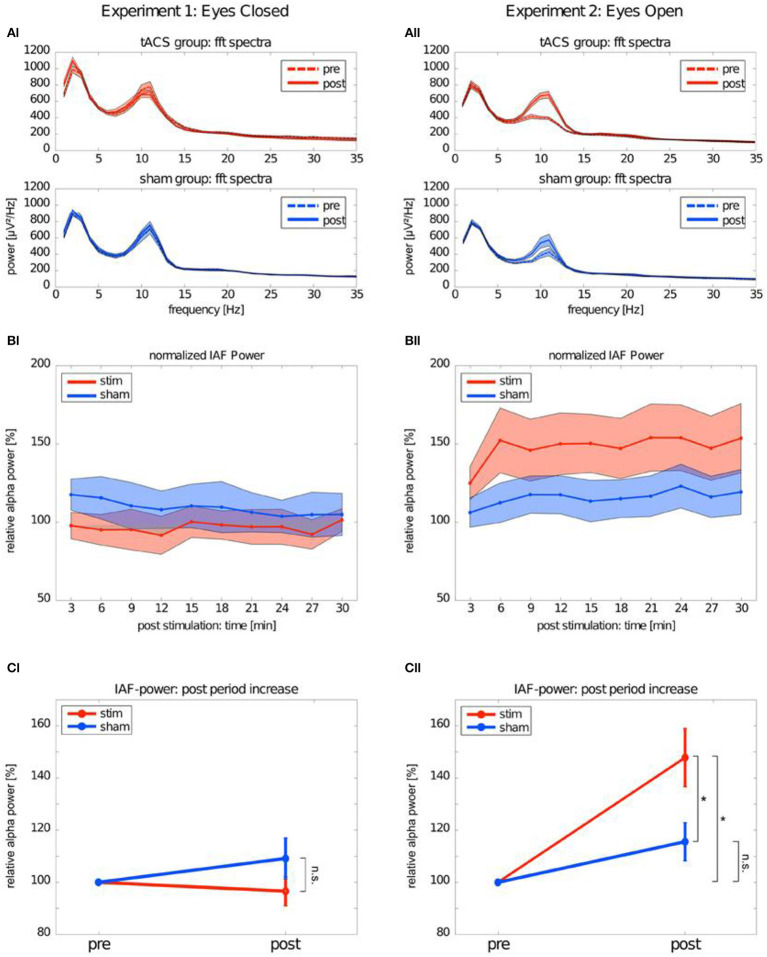
Figure 1.
Alpha band after transcranial alternating current stimulation (tACS). This figure depicts the difference in EEG power spectrum between Experiment 1: Eyes-closed and Experiment 2: Eyes-open conditions. (AI) tACS group:fft spectra depicts pre- and post-stimulation changes in power spectrum for EEG frequencies in real tACS in eyes-closed condition. Axis y stays for power values (microvolts) and axis x stands for frequency values (Hz). tACS group: fft spectra depicts pre- and post-stimulation changes in power spectrum for EEG frequencies in sham tACS in eyes-closed condition. (BI) Normalized IAF power represents pre- and post-stimulation difference in relative power of individual alpha frequency (IAF) in real tACS group in eyes-closed condition. Axis y stays for power values (microvolts) and axis x stands for frequency values (Hz). (CI) IAF power post period increase represents pre- and post-stimulation difference in relative alpha power between stim and sham in eyes-closed condition. (AII) tACS group:fft spectra depicts pre- and post-stimulation changes in power spectrum for EEG frequencies in real tACS in eyes-open condition. Axis y stays for power values (microvolts) and axis x stands for frequency values (Hz). tACS group: fft spectra depicts pre- and post-stimulation changes in power spectrum for EEG frequencies in sham tACS in eyes-open condition. (BII) Normalized IAF power represents pre- and post-stimulation diference in relative power of individual alpha frequency (IAF) in real tACS group in eyes-open condition. Axis y stays for power values (microvolts) and axis x stands for frequency values (Hz). (CII) IAF power post period increase represents pre- and post-stimulation difference in relative alpha power between stim and sham in eyes-open condition. The symbol *represents the diference in post-stimulation alpha power between stim and sham group in eyes-open condition. [with the author's permission, taken from Neuling et al. (2013).

