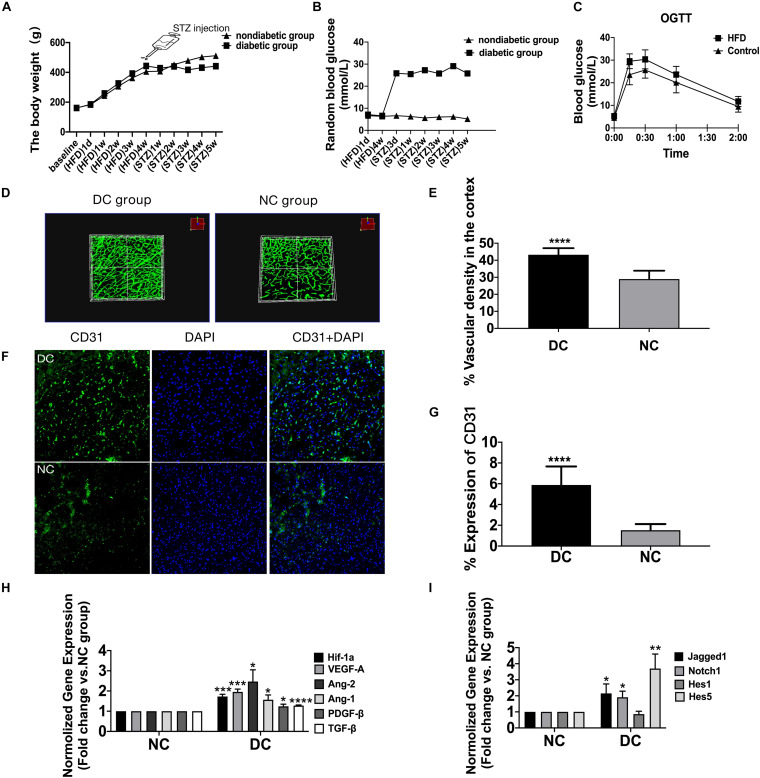
FIGURE 1.
The enhanced yet dysfunctional baseline neovascularization in HFD/STZ rat model before cerebral ischemia. (A) Mean body weight changes during the time of high-fat diet and after the STZ treatment (n = 42 in each group). (B) Mean plasma glucose concentration changes during the time of high-fat diet and after the STZ treatment (n = 42 in each group). (C) Mean plasma glucose concentration in response to an oral glucose challenge in chow-fed and HFD-fed rats (n = 42 in each group). (D) Representative FITC-perfused cerebrovascular images from non-diabetic control and diabetic control rats showing differences in neovascularization in the cerebral cortex (Z-step was defined as 1.984 μm, image size 512 × 512 pixels, 20 × lens). (E) Significant differences in vascular density were observed in the cortex in both non-diabetic control and diabetic control groups. (F) The staining of ECs in the cerebral cortex of diabetic control and non-diabetic control. Magnification ×200. Scale bar = 100 μm. (G) ECs were markedly increased in the cortex of the diabetic control group compared with non-diabetic control group. (H) The gene expression of Hif-1a, VEGF-A, Ang-2, Ang-1, TGF-β, and PDGF-β was increased in diabetic control group compared with non-diabetic control group. (I) The gene expression of Jagged1, Notch1, Hes1, and Hes5 was increased in diabetic control group compared with non-diabetic control group. *p < 0.05 vs. NC group, **p < 0.01 vs. NC group, ***p < 0.001 vs. NC group, ****p < 0.0001 vs. NC group.

